










Karamtara Q2 Revenue Rises 62% as EBITDA Margin Falls
Key highlights
- Karamtara’s Q2FY27 revenue from operations rose 62% year on year to Rs 1,646.7 crore.
- Karamtara’s Q2FY27 EBITDA increased 46% to Rs 196.2 crore, while EBITDA margin fell to 11.9% from 13.2%.
- Solar energy products accounted for 71% of Karamtara’s Q2FY27 revenue and 75% of H1FY27 revenue.
- Karamtara’s total debt was Rs 1,004.1 crore at H1FY27, compared with Rs 1,030.1 crore at FY26.
powered by IRIS
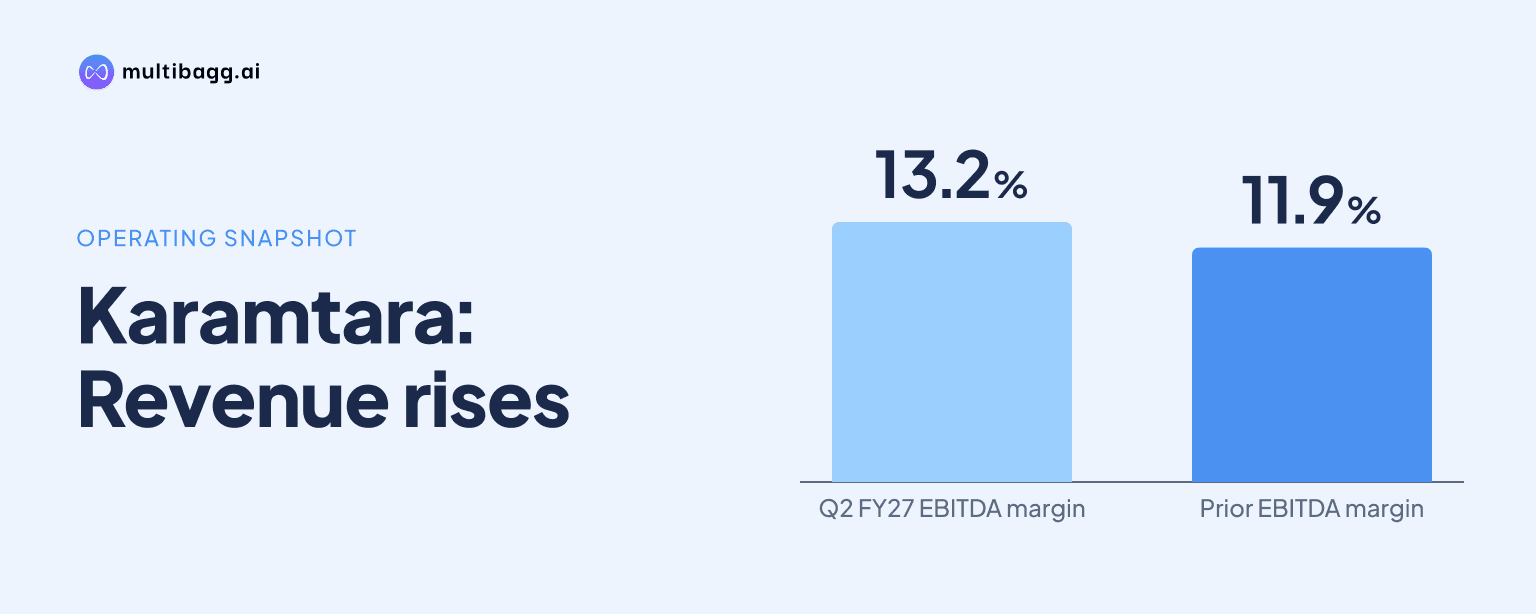
Karamtara reported consolidated Q2FY27 revenue from operations of Rs 1,646.7 crore, up 62% year on year, while its earnings before interest, tax, depreciation and amortisation (EBITDA) margin declined 130 basis points to 11.9% from 13.2%. EBITDA rose 46% to Rs 196.2 crore and profit after tax reached Rs 94.6 crore, up 37%.
Know Karamtara Engineering inside out
Results, valuation, peers and who's buying, in one view.
How did Karamtara perform in Q2FY27?
Karamtara’s Q2FY27 revenue from operations increased 62% year on year to Rs 1,646.7 crore from Rs 1,016.5 crore in Q2FY26. Revenue was also 4% above Rs 1,580.9 crore in Q1FY27, making Q2 the larger of the two reported quarters in H1FY27, the first half of FY27.
EBITDA increased 46% to Rs 196.2 crore in Q2FY27 from Rs 134.5 crore a year earlier. Profit before tax rose 38% to Rs 128.6 crore from Rs 93.1 crore, while profit after tax increased 37% to Rs 94.6 crore from Rs 69 crore. Revenue therefore expanded faster than both EBITDA and profit after tax during the quarter.
Karamtara’s Q2FY27 revenue mix was led by solar energy products at 71%. Transmission lattice towers contributed 21%, followed by fasteners at 5%, wind towers at 2%, and conductor and insulator fittings at 1%. The presentation does not give revenue values or prior-year shares for those segments, so it does not identify the individual product line behind the 62% sales increase.
Why did Karamtara’s EBITDA margin decline in Q2FY27?
Karamtara’s EBITDA margin declined to 11.9% in Q2FY27 from 13.2% in Q2FY26, a fall of 130 basis points. A basis point equals one-hundredth of a percentage point. EBITDA still increased by Rs 61.7 crore because revenue grew by Rs 630.2 crore over the same period.
Cost of material consumed rose to Rs 828.6 crore in Q2FY27 from Rs 601.8 crore in Q2FY26. Employee benefit expenses increased to Rs 68.2 crore from Rs 41.4 crore, while other expenses rose to Rs 553.7 crore from Rs 238.8 crore. These increases meant EBITDA grew 46%, below the 62% revenue growth rate.
Costs below EBITDA also rose year on year. Finance cost increased to Rs 47.9 crore from Rs 31 crore, depreciation rose to Rs 20.4 crore from Rs 11.6 crore, and tax increased to Rs 34 crore from Rs 24.1 crore. Profit after tax margin consequently fell 110 basis points to 5.7% from 6.8%.
The sequential comparison was different. EBITDA margin improved to 11.9% in Q2FY27 from 11.0% in Q1FY27, while profit after tax margin increased to 5.7% from 5.5%. EBITDA rose 13% quarter on quarter to Rs 196.2 crore, compared with 4% revenue growth, and profit after tax increased 8% from Rs 87.3 crore.
Got a follow-up? Ask IRIS
How did Karamtara’s H1FY27 results compare with last year?
Karamtara reported H1FY27 revenue from operations of Rs 3,227.7 crore, up 67% from Rs 1,934.1 crore in H1FY26. EBITDA rose 46% to Rs 370 crore from Rs 254.3 crore, while profit after tax increased 41% to Rs 181.9 crore from Rs 129.1 crore. The half-year pattern matched Q2, with revenue growing more quickly than earnings.
Karamtara’s H1FY27 EBITDA margin was 11.5%, down from 13.1% in H1FY26, a 160-basis-point decline. Profit after tax margin was 5.6%, compared with 6.7%, a reduction of 110 basis points. Finance cost rose to Rs 89.2 crore from Rs 61.2 crore and depreciation increased to Rs 40 crore from Rs 21.2 crore.
Solar energy products accounted for 75% of H1FY27 revenue, compared with 71% in Q2FY27. Transmission lattice towers accounted for 17% in the half year versus 21% in Q2, while wind towers represented 5% versus 2%. Fasteners accounted for 2% in H1FY27 and 5% in Q2FY27, while conductor and insulator fittings remained at 1% in both periods.
What do Karamtara’s balance sheet and cash flow show?
Karamtara’s total assets were Rs 5,419.2 crore at H1FY27, compared with Rs 4,142.2 crore at FY26. Fixed assets, including intangible assets and capital work in progress, increased to Rs 2,056 crore from Rs 1,723 crore. Current assets rose to Rs 3,124.9 crore from Rs 2,250 crore.
Shareholders’ funds increased to Rs 2,089 crore at H1FY27 from Rs 1,219.9 crore at FY26. Total debt was Rs 1,004.1 crore, below Rs 1,030.1 crore at FY26. The presentation reports net cash from financing activities of Rs 614.2 crore in H1FY27, compared with Rs 125.8 crore in H1FY26, but does not explain the specific financing inflows and outflows.
Net cash from operating activities declined to Rs 114 crore in H1FY27 from Rs 292.7 crore in H1FY26. Net cash used in investing activities increased to Rs 523.6 crore from Rs 378.5 crore. Cash and cash equivalents ended H1FY27 at Rs 279.4 crore, compared with Rs 70.8 crore at the end of H1FY26, after a net increase of Rs 204.6 crore.
Conclusion
Karamtara’s Q2FY27 results combined rapid sales growth with lower year-on-year profitability margins. Revenue rose 62% to Rs 1,646.7 crore, but EBITDA growth of 46% and profit after tax growth of 37% trailed sales growth as material, employee and other expenses increased. Solar energy products were the largest reported category, accounting for 71% of quarterly revenue and 75% of H1 revenue.
The disclosed development to watch is Karamtara’s proposed wholly owned subsidiary, Karamtara Defence & Aerospace Limited. Management says product selection and the associated capital-expenditure plan remain under evaluation, with investment decisions dependent on technical feasibility and commercial viability. Karamtara has not disclosed a timeline, product choice or investment amount for the proposed activity.