










Maan Aluminium revenue rose 27% as EBITDA margin fell to 2%
Key highlights
- Maan Aluminium reported HY1 FY27 revenue of Rs 511 crore, up 27% from Rs 402 crore in HY1 FY26.
- Maan Aluminium's HY1 FY27 EBITDA was Rs 12 crore versus Rs 18 crore a year earlier, while margin fell to 2% from 4%.
- Maan Aluminium reported FY26 working-capital days of 67.2, compared with 24.27 days in FY22.
- Maan Aluminium's indicative FY27 capital-expenditure plan is Rs 45 crore within a Rs 166 crore FY25-FY28 programme.
powered by IRIS
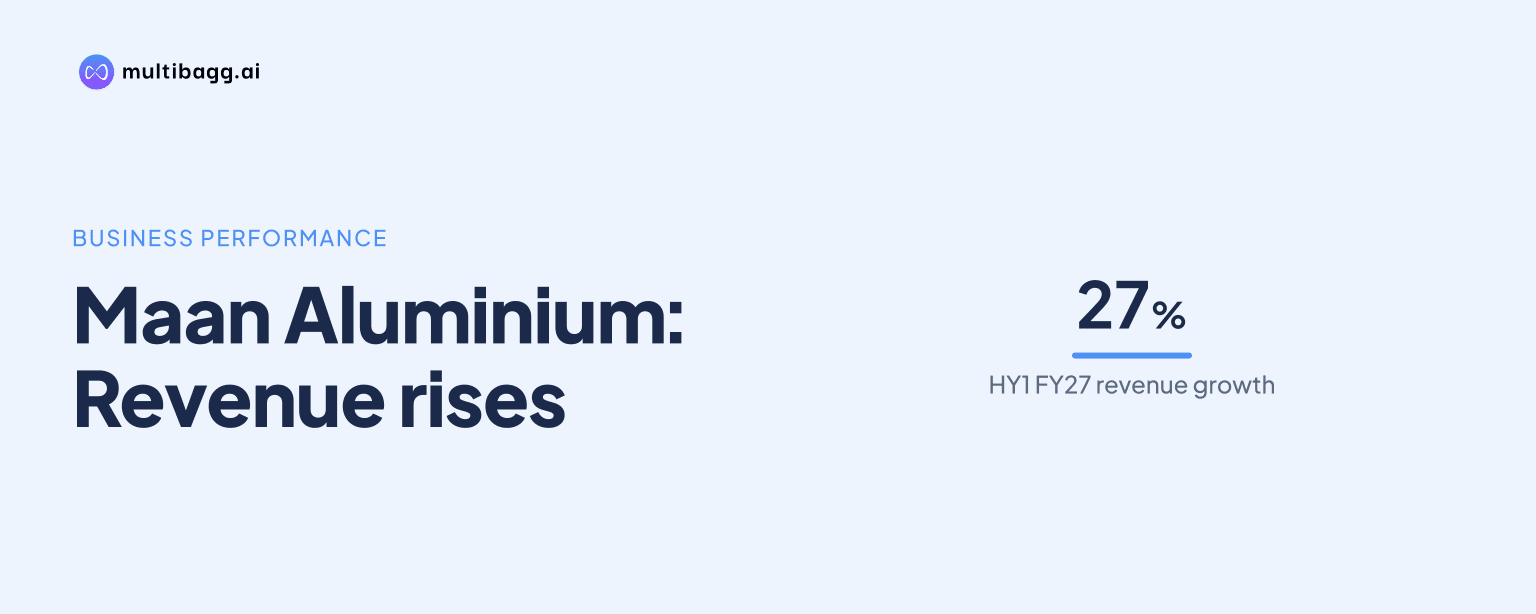
Maan Aluminium Limited reported HY1 FY27 revenue of Rs 511 crore, 27% above HY1 FY26, but EBITDA declined 33% to Rs 12 crore and the EBITDA margin narrowed from 4% to 2%. The presentation also reports profit after tax of Rs 4 crore in its HY1 FY27 profit-and-loss table, while a separate key-performance-indicator table shows Rs 6 crore.
Know Maan Aluminium inside out
Results, valuation, peers and who's buying, in one view.
What did Maan Aluminium report for HY1 FY27?
Maan Aluminium reported revenue from operations of Rs 511 crore in HY1 FY27, compared with Rs 402 crore in HY1 FY26, an increase of Rs 109 crore or 27%. The presentation also records Rs 232 crore of revenue from operations for Q1 FY27.
The revenue increase did not translate into higher operating profit. EBITDA, or earnings before interest, tax, depreciation and amortisation, was Rs 12 crore in HY1 FY27 versus Rs 18 crore a year earlier. That represents a Rs 6 crore decline, which the performance-highlights page describes as a 33% year-on-year fall.
Profit before tax was Rs 6 crore in HY1 FY27, down from Rs 11 crore in HY1 FY26. Basic earnings per share were Rs 0.67 for HY1 FY27, compared with Rs 1.57 in the prior-year half and Rs 0.52 in Q1 FY27. These figures accompany the profit-and-loss table that records HY1 FY27 profit after tax, or PAT, at Rs 4 crore.
Why did Maan Aluminium's EBITDA margin fall to 2%?
Maan Aluminium's EBITDA margin fell to 2% in HY1 FY27 as its reported cost of goods sold and operating expenses rose 29%, faster than the 27% increase in revenue from operations. Costs were Rs 503 crore for the half-year, up from Rs 389 crore in HY1 FY26, while revenue increased to Rs 511 crore from Rs 402 crore.
The result was a 2-percentage-point reduction in EBITDA margin, from 4% in HY1 FY26 to 2% in HY1 FY27. The presentation also records a 3% EBITDA margin in Q1 FY27, placing the half-year margin below the first-quarter level. The presentation does not provide management's explanation for the increase in costs.
Other income declined from Rs 5 crore in HY1 FY26 to Rs 4 crore in HY1 FY27. Finance cost fell from Rs 3 crore to Rs 2 crore, while depreciation remained Rs 4 crore in both periods. Those movements did not offset the Rs 6 crore decline in EBITDA, and PAT margin reduced from 2% to 1%.
Got a follow-up? Ask IRIS
How do Maan Aluminium's FY27 results compare with earlier years?
Maan Aluminium's HY-FY27 revenue of Rs 511 crore cannot be directly compared with the Rs 808.71 crore reported for all of FY26 because HY-FY27 is a partial-year period. The annual revenue series shows Rs 813.85 crore in FY23, Rs 953.03 crore in FY24, Rs 810.17 crore in FY25 and Rs 808.71 crore in FY26, with FY26 slightly below FY25.
The key-performance-indicator table places HY-FY27 EBITDA at Rs 11 crore and its EBITDA margin at 2%, compared with Rs 30.60 crore and 4% in FY26. The Rs 11 crore figure differs from the Rs 12 crore shown in the HY1 FY27 profit-and-loss snapshot and performance highlights, so the presentation does not provide a single consistent half-year EBITDA amount across its pages.
Profitability also declined across the annual series displayed. PAT was Rs 50 crore in FY23, Rs 33 crore in FY24, Rs 16 crore in FY25 and Rs 13 crore in FY26; the key-performance-indicator table then reports Rs 6 crore for HY-FY27 and a 1% PAT margin. This differs from the Rs 4 crore HY1 FY27 PAT in the half-year profit-and-loss snapshot, which shows a 55% year-on-year reduction.
What do Maan Aluminium's working-capital and return metrics show?
Maan Aluminium's working-capital days increased to 67.2 days in FY26 from 24.27 days in FY22, a rise of 42.93 days over four financial years. The measure was 28.16 days in FY23, 32.84 days in FY24 and 39.79 days in FY25 before the FY26 increase.
Return on capital employed, or ROCE, declined from 38% in FY23 to 4% in FY26 and 2% in HY-FY27. Return on equity, or ROE, moved from 47% in FY23 to 5% in FY26 and 1% in HY-FY27. Maan Aluminium provides the ratios but does not explain the operational or balance-sheet factors behind their movement.
What capital expenditure does Maan Aluminium plan next?
Maan Aluminium plans indicative cumulative capital expenditure of Rs 166 crore across FY25 to FY28, including Rs 45 crore in FY27 and Rs 37 crore in FY28. The company labels FY25 and FY26 as actuals, while FY27 and FY28 are projected amounts subject to management discretion.
Of the Rs 166 crore cumulative programme, Rs 90 crore is allocated to new plants under development and Rs 76 crore to listed projects at the existing Pithampur unit. Maan Aluminium allocates 57% of planned capital expenditure to new plants and 43% to the existing unit; its FY27 plan includes Rs 10 crore for new dies and general capital expenditure.
Conclusion
Maan Aluminium delivered higher HY1 FY27 sales but lower operating and net profitability: revenue increased 27% to Rs 511 crore, while reported EBITDA margin halved to 2% from 4%. Costs and operating expenses rose 29% to Rs 503 crore, exceeding revenue growth, while the longer-term presentation shows working-capital days rising to 67.2 in FY26 and ROCE falling to 2% in HY-FY27.
The next disclosed item to watch is execution of the indicative Rs 45 crore FY27 capital-expenditure plan, followed by Rs 37 crore proposed for FY28. Management's plan directs 57% of the Rs 166 crore FY25-FY28 programme toward new plants under development, while the presentation leaves unresolved the differing HY1 FY27 EBITDA and PAT figures across its financial tables.