










Maximus H1 revenue rises 39% while net profit falls 20%
Key highlights
- Maximus reported H1 FY27 revenue from operations of Rs 118.64 crore, up 38.99% year on year.
- H1 FY27 net profit fell 19.90% to Rs 4.10 crore from Rs 5.12 crore.
- EBITDA margin declined to 7.74% in H1 FY27 from 10.18% in H1 FY26.
- Combined borrowings rose to Rs 51.52 crore at H1 FY27 from Rs 39.40 crore at FY26.
powered by IRIS
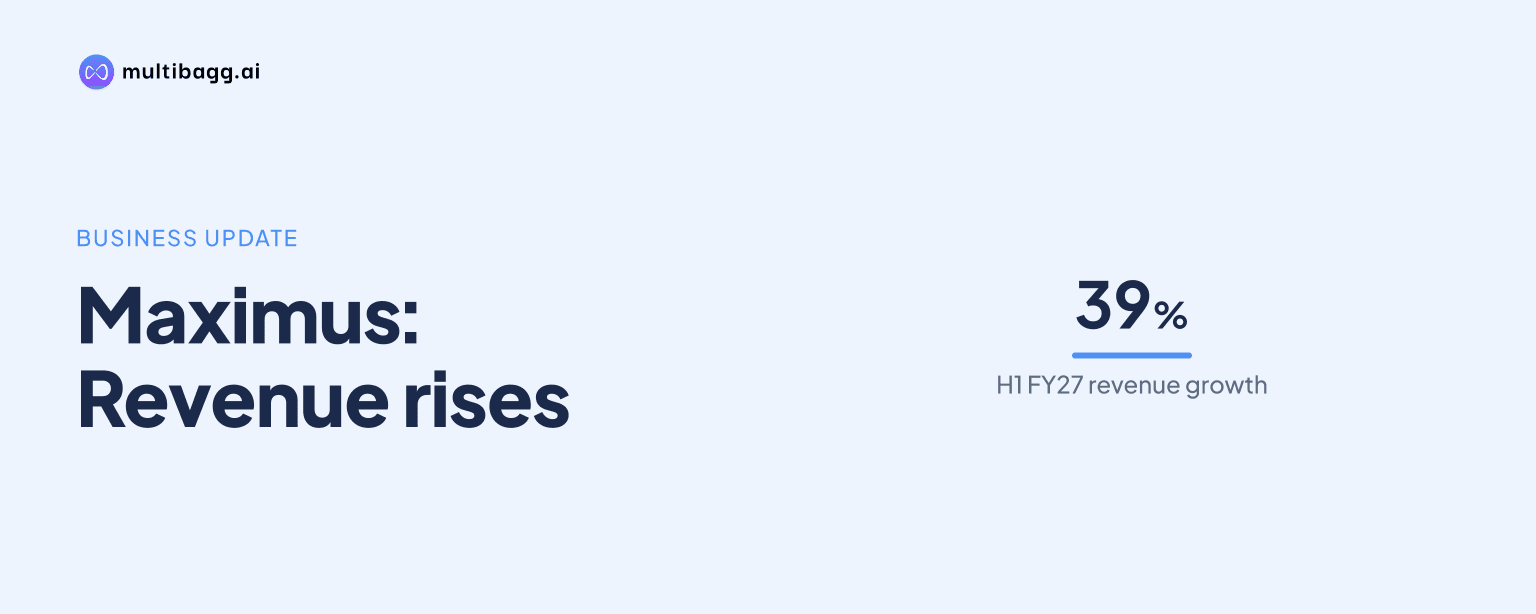
Maximus International reported H1 FY27 revenue from operations of Rs 118.64 crore, up 38.99% year on year, but net profit fell 19.90% to Rs 4.10 crore as EBITDA margin declined to 7.74% from 10.18%. Maximus added revenue faster than operating profit, while higher depreciation and finance costs further reduced profit after tax.
Know Maximus International inside out
Results, valuation, peers and who's buying, in one view.
What were Maximus’s H1 FY27 revenue and profit figures?
Maximus recorded total revenue of Rs 119.30 crore in H1 FY27, compared with Rs 86.73 crore in H1 FY26, while revenue from operations rose to Rs 118.64 crore from Rs 85.36 crore. Revenue from operations grew 38.99%, ahead of the 37.55% increase in total revenue, because other income declined to Rs 65.67 lakh from Rs 1.37 crore.
Net profit was Rs 4.10 crore in H1 FY27, down from Rs 5.12 crore a year earlier, and diluted earnings per share fell to Rs 0.30 from Rs 0.37. Profit before tax decreased to Rs 4.79 crore from Rs 5.75 crore, although earnings before interest, tax, depreciation and amortisation, or EBITDA, increased 5.65% to Rs 9.18 crore.
The comparison shows that revenue from operations increased by Rs 33.28 crore, whereas EBITDA increased by Rs 49.09 lakh and net profit decreased by Rs 1.02 crore. Maximus states that it calculates EBITDA on revenue from operations and net profit margin on total revenue.
Why did Maximus’s H1 FY27 margins decline despite higher sales?
Maximus’s EBITDA margin fell 2.44 percentage points to 7.74% in H1 FY27 because total expenses increased to Rs 110.12 crore from Rs 78.04 crore. That 41.10% increase in expenses exceeded the 37.55% growth in total revenue, leaving EBITDA growth at 5.65% despite the Rs 32.57 crore increase in total revenue.
Cost of material consumed rose to Rs 85.31 crore from Rs 55.91 crore, an increase of Rs 29.41 crore, while purchases of stock in trade rose to Rs 16.29 crore from Rs 13.66 crore. The change in inventories was negative Rs 71.37 lakh in H1 FY27, versus a positive Rs 21.08 lakh in H1 FY26; employee benefit expense was Rs 4.23 crore and other expenses were Rs 5.00 crore.
The movement continued below EBITDA, with depreciation and amortisation rising to Rs 1.29 crore from Rs 1.00 crore and finance costs rising to Rs 3.10 crore from Rs 1.94 crore. Earnings before interest and tax increased only 2.60% to Rs 7.89 crore, while net profit margin declined 2.46 percentage points to 3.44% from 5.90%.
How did Maximus’s Q2 FY27 result compare with Q2 FY26?
Maximus’s Q2 FY27 revenue from operations rose 28.14% to Rs 58.74 crore, but EBITDA declined 4.41% to Rs 4.60 crore and net profit fell 26.49% to Rs 2.05 crore. Quarterly EBITDA margin narrowed to 7.84% from 10.51%, and net profit margin reduced to 3.46% from 5.93%.
Total revenue was Rs 59.30 crore in Q2 FY27, compared with Rs 47.08 crore in Q2 FY26. Cost of material consumed increased to Rs 35.62 crore from Rs 33.81 crore, while the change in inventories rose to Rs 8.78 crore from Rs 2.90 lakh, contributing to total expenses of Rs 54.69 crore against Rs 42.26 crore.
Depreciation and amortisation was Rs 65.57 lakh in Q2 FY27, compared with Rs 52.58 lakh a year earlier, while finance costs increased to Rs 1.58 crore from Rs 1.02 crore. Consequently, profit before tax declined to Rs 2.37 crore from Rs 3.28 crore, even as current tax expense fell to Rs 20.11 lakh from Rs 48.23 lakh.
Got a follow-up? Ask IRIS
How does H1 FY27 compare with Maximus’s recent annual trend?
Maximus’s total revenue rose from Rs 113.13 crore in FY24 to Rs 158.75 crore in FY25 and Rs 188.54 crore in FY26. In FY26, total revenue increased by Rs 29.79 crore from FY25, whereas EBITDA increased by Rs 24.54 lakh to Rs 13.53 crore and net profit increased by Rs 19.89 lakh to Rs 9.30 crore.
Net profit margin declined from 7.06% in FY24 to 5.73% in FY25 and 4.93% in FY26. The 3.44% net profit margin reported for H1 FY27 was therefore below the FY26 full-year figure, while the H1 EBITDA margin of 7.74% was also below the 10.18% reported in H1 FY26.
Diluted earnings per share was Rs 0.68 in both FY25 and FY26, after Rs 0.63 in FY24. The H1 FY27 figure of Rs 0.30 was lower than Rs 0.37 in H1 FY26, matching the reported 19.90% fall in half-year net profit despite the 38.99% increase in revenue from operations.
What balance-sheet changes accompanied Maximus’s H1 FY27 growth?
Maximus’s trade receivables rose to Rs 145.68 crore at H1 FY27 from Rs 121.95 crore at FY26, while inventories declined to Rs 9.83 crore from Rs 12.34 crore. Total current assets increased to Rs 175.33 crore from Rs 155.20 crore, and cash and cash equivalents rose to Rs 1.62 crore from Rs 1.24 crore.
Combined current and non-current borrowings increased to Rs 51.52 crore at H1 FY27 from Rs 39.40 crore at FY26. Current borrowings were Rs 36.13 crore and non-current borrowings were Rs 15.38 crore, while trade payables rose to Rs 49.92 crore from Rs 37.68 crore.
Total assets and total liabilities each stood at Rs 210.31 crore at H1 FY27, compared with Rs 179.50 crore at FY26. Other equity increased to Rs 78.41 crore from Rs 73.46 crore, while H1 FY27 finance costs of Rs 3.10 crore were higher than the Rs 1.94 crore reported in H1 FY26.
Conclusion
Maximus delivered substantially higher H1 FY27 operating revenue, but the additional sales did not translate into comparable EBITDA or net-profit growth. Revenue from operations increased by Rs 33.28 crore year on year, while EBITDA increased by Rs 49.09 lakh and net profit declined by Rs 1.02 crore, alongside lower EBITDA and net profit margins.
The presentation does not disclose a margin target, turnaround plan or scheduled financial event. The unresolved issue for subsequent results is whether expense growth, including Rs 85.31 crore of material consumption, and finance costs of Rs 3.10 crore change relative to revenue growth, while receivables of Rs 145.68 crore and borrowings of Rs 51.52 crore remain key balance-sheet measures to track.