










Maximus receivables reach Rs 145.6815 crore in H1 FY27
Key highlights
- Maximus trade receivables reached Rs 145.6815 crore in H1 FY27, up from Rs 121.9483 crore at FY26.
- Maximus total liabilities increased to Rs 210.3114 crore in H1 FY27 from Rs 179.4954 crore at FY26.
- Maximus generated Rs 3.7975 crore of operating cash inflow in H1 FY27 after an Rs 8.2510 crore outflow in FY26.
- Maximus total borrowings reached Rs 51.5168 crore in H1 FY27, including Rs 36.1329 crore of current borrowings.
powered by IRIS
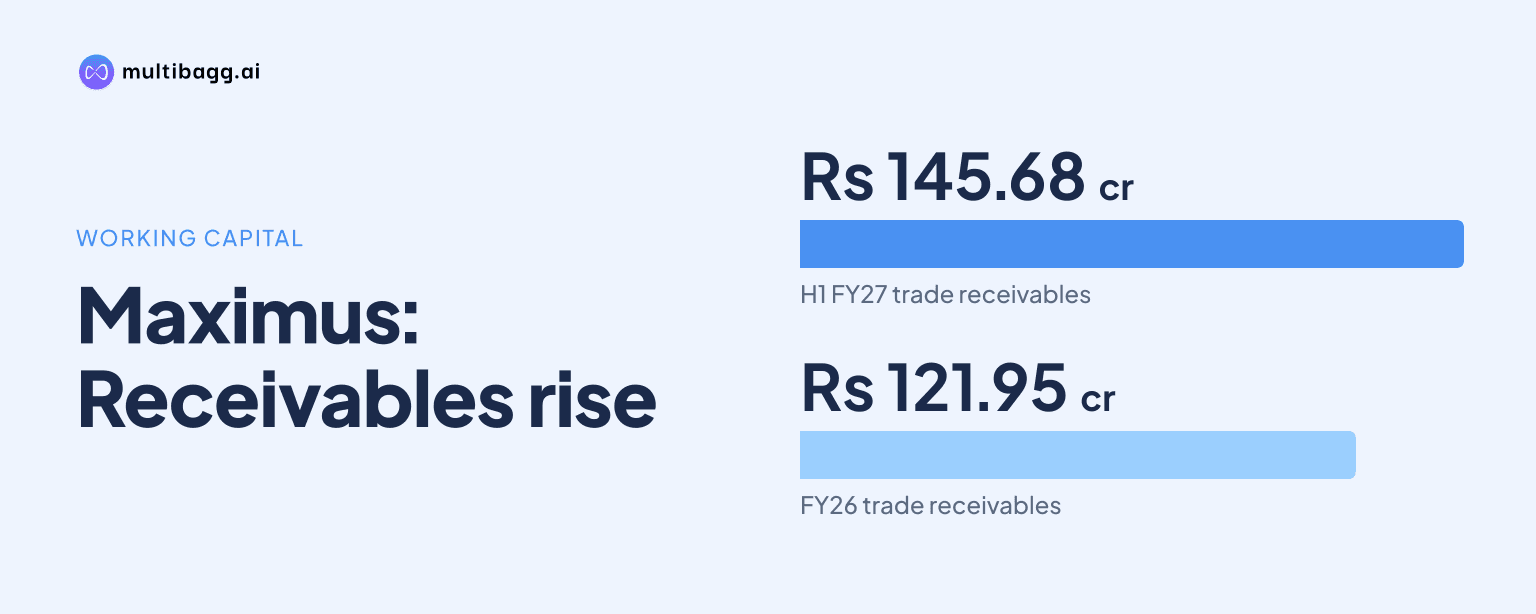
Maximus International Limited reported trade receivables of Rs 145.6815 crore in H1 FY27, up from Rs 121.9483 crore at FY26, as total liabilities rose to Rs 210.3114 crore. The company recorded Rs 3.7975 crore of operating cash inflow in the half year, following operating cash outflows in FY25 and FY26.
Know Maximus International inside out
Results, valuation, peers and who's buying, in one view.
Why did Maximus receivables increase in H1 FY27?
Maximus ended H1 FY27 with Rs 145.6815 crore of trade receivables, Rs 23.7332 crore above the Rs 121.9483 crore reported at FY26 and Rs 67.2573 crore above FY25's Rs 78.4242 crore. Trade receivables were the largest current-asset line item at H1 FY27, exceeding inventories of Rs 9.8264 crore and cash and cash equivalents of Rs 1.6204 crore. The presentation does not provide an ageing analysis, customer concentration data or a stated reason for the receivables increase.
Revenue from operations increased 38.99% year on year to Rs 118.6417 crore in H1 FY27 from Rs 85.3576 crore in H1 FY26. Total current assets increased to Rs 175.3296 crore from Rs 155.1984 crore at FY26, with receivables accounting for more than the overall increase. Inventories moved in the other direction, declining by Rs 2.5182 crore from Rs 12.3446 crore at FY26 to Rs 9.8264 crore.
How did Maximus liabilities and borrowings change?
Maximus reported total liabilities of Rs 210.3114 crore at H1 FY27, compared with Rs 179.4954 crore at FY26 and Rs 133.0026 crore at FY25. Current liabilities rose to Rs 91.2942 crore from Rs 75.5788 crore at FY26. The presentation does not disclose debt maturities, borrowing rates or the terms attached to the borrowings.
Total borrowings were Rs 51.5168 crore at H1 FY27, comprising Rs 15.3829 crore of non-current borrowings and Rs 36.1329 crore of current borrowings. This was Rs 12.1197 crore higher than the Rs 39.3971 crore total at FY26. Trade payables rose by Rs 12.2403 crore to Rs 49.9182 crore over the same period, meaning supplier obligations and borrowings both increased while inventories declined.
Got a follow-up? Ask IRIS
Did Maximus generate operating cash in H1 FY27?
Maximus generated Rs 3.7975 crore of net cash from operating activities in H1 FY27, compared with an outflow of Rs 8.2510 crore in FY26 and an outflow of Rs 14.5674 crore in FY25. The H1 FY27 operating inflow marks a change from the negative operating cash flow reported in the preceding two full financial years. H1 FY27 is a half-year period, however, while FY25 and FY26 are full-year periods, so the cash-flow figures are not directly comparable on a period-length basis.
Investing activities used Rs 12.4338 crore in H1 FY27, compared with outflows of Rs 5.0194 crore in FY26 and Rs 7.0306 crore in FY25. Financing activities provided Rs 9.0140 crore in H1 FY27, after providing Rs 12.6756 crore in FY26. The three categories combined for a Rs 37.77 lakh increase in cash and cash equivalents during H1 FY27.
Cash and cash equivalents increased from Rs 1.2427 crore at the beginning of H1 FY27 to Rs 1.6204 crore at the end of the period. The balance sheet also showed bank balances other than cash and cash equivalents of Rs 6.5862 crore at H1 FY27, compared with Rs 6.3974 crore at FY26. The presentation does not identify the individual uses within the Rs 12.4338 crore investing cash outflow.
What do Maximus earnings show alongside the funding increase?
Maximus reported total revenue of Rs 119.2984 crore in H1 FY27, compared with Rs 86.7318 crore in H1 FY26, while earnings before interest, tax, depreciation and amortisation, or EBITDA, increased to Rs 9.1832 crore from Rs 8.6923 crore. EBITDA margin declined to 7.74% from 10.18%. Revenue therefore grew 38.99%, while EBITDA rose 5.65%.
Financial costs increased to Rs 3.1044 crore in H1 FY27 from Rs 1.9383 crore in H1 FY26. Profit before tax fell to Rs 4.7850 crore from Rs 5.7514 crore, and net profit declined 19.90% to Rs 4.0986 crore from Rs 5.1167 crore. Net profit margin declined to 3.44% from 5.90%, while diluted earnings per share fell to Rs 0.30 from Rs 0.37.
Other equity increased to Rs 78.4130 crore at H1 FY27 from Rs 73.4560 crore at FY26, while equity share capital was unchanged at Rs 13.6036 crore. Loan and other financial assets rose to Rs 17.5733 crore from Rs 6.2609 crore. These balance-sheet movements accompanied an increase in total assets to Rs 210.3114 crore at H1 FY27 from Rs 179.4954 crore at FY26.
Conclusion
Maximus' H1 FY27 balance-sheet expansion was led by a Rs 23.7332 crore increase in trade receivables since FY26, alongside rises of Rs 12.2403 crore in trade payables and Rs 12.1197 crore in total borrowings. The Rs 3.7975 crore operating cash inflow differed from the cash outflows reported in FY25 and FY26, but it was lower than the Rs 12.4338 crore investing outflow in the half year.
The presentation leaves receivables ageing, collection plans, debt maturities, borrowing rates and the uses of the investing outflow undisclosed. Subsequent disclosures will be relevant for changes in the Rs 145.6815 crore receivables balance, Rs 36.1329 crore of current borrowings and Rs 49.9182 crore of trade payables reported at H1 FY27.