










Moneyview Q2 FY27 PAT rose 169% as income grew 42.4%
Key highlights
- Moneyview reported Q2 FY27 PAT of Rs 201 crore, up 169.1% year on year.
- Moneyview’s Q2 FY27 total income was Rs 1,146 crore, up 42.4% year on year.
- Moneyview reported Q2 FY27 loan disbursals of Rs 7,701 crore, up 41.3% year on year.
- Moneyview’s Q2 FY27 GNPA was 2.42%, while collection efficiency was 98.64%.
powered by IRIS
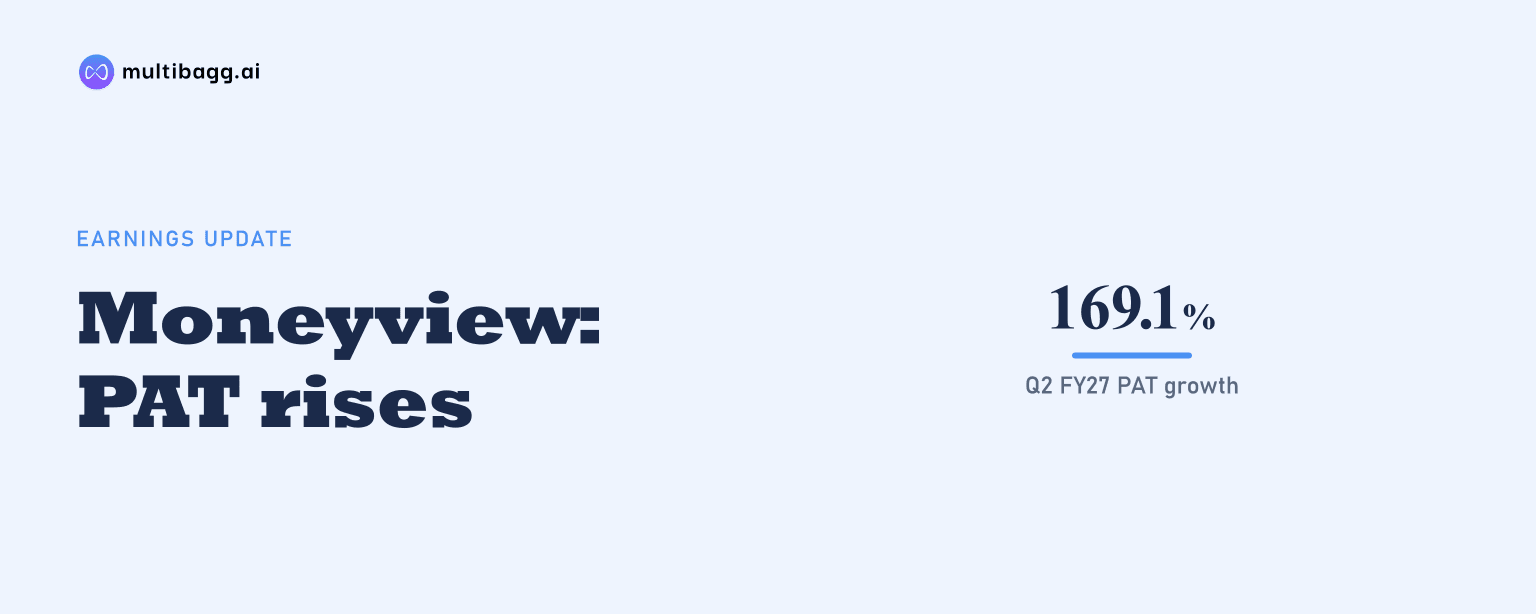
Moneyview Limited reported Q2 FY27 profit after tax of Rs 201 crore, up 169.1% year on year, as total income rose 42.4% to Rs 1,146 crore. Moneyview attributed the result to loan-disbursal growth, improving credit quality and operating leverage, while its operating-expense ratio declined to 34.5%.
Know Moneyview inside out
Results, valuation, peers and who's buying, in one view.
How did Moneyview’s Q2 FY27 profit compare with income growth?
Moneyview’s Q2 FY27 profit growth exceeded its income growth on both reported comparison bases. Profit after tax, or PAT, was Rs 201 crore, up 169.1% year on year and 15.6% quarter on quarter, while total income was Rs 1,146 crore, up 42.4% year on year and 7.6% quarter on quarter.
The difference between the two growth rates is the central feature of the Q2 FY27 snapshot. Moneyview reported PAT growth of 169.1% against income growth of 42.4% year on year, and PAT growth of 15.6% against income growth of 7.6% quarter on quarter. The presentation identifies operating leverage, improved credit quality and strong disbursals as the contributing mechanisms.
Moneyview’s Q2 FY27 and half-year figures through September 30, 2026 are unaudited, although the company says they were subject to a limited review by its statutory auditors. The presentation was prepared under Indian Accounting Standard 34, which covers interim financial reporting, and notes that individual amounts may not sum because of rounding.
What changed in Moneyview’s cost ratio during Q2 FY27?
Moneyview’s operating expenditure, or opex, was 34.5% of income in Q2 FY27, down 10.1 percentage points year on year and 3.9 percentage points quarter on quarter. This lower ratio accompanied Rs 1,146 crore of total income and Rs 201 crore of PAT during the quarter.
The reported ratio change indicates that income increased faster than the share of income represented by opex, which is the operating-leverage mechanism cited by Moneyview. The source does not provide an absolute opex figure, prior-period expense amounts or a line-by-line cost bridge, so it does not show how much of the Rs 201 crore PAT resulted from individual expense categories.
Moneyview also reported return on equity, or RoE, of 27.9% in Q2 FY27. The company specifies that this calculation uses net worth including the initial public offering, or IPO, raise, meaning the disclosed RoE is measured against an equity base that includes the IPO proceeds.
How fast did Moneyview’s lending volumes and managed AUM grow?
Moneyview reported Q2 FY27 loan disbursals of Rs 7,701 crore, up 41.3% year on year and 7.7% quarter on quarter. Managed assets under management, or managed AUM, stood at Rs 23,892 crore as of September 2026, up 28.4% year on year and 6.1% quarter on quarter.
Disbursals grew faster than managed AUM in each comparison shown by Moneyview. The 41.3% year-on-year increase in Rs 7,701 crore of disbursals was 12.9 percentage points above the 28.4% increase in managed AUM, while the 7.7% quarter-on-quarter disbursal increase was 1.6 percentage points above the 6.1% AUM increase.
Moneyview describes its lending distribution as digital-only, with loan disbursal in less than 10 minutes and no paperwork. It reports 99.5% PIN-code coverage with zero branches, but the presentation does not provide a product-wise, partner-wise or borrower-cohort split of the Rs 7,701 crore quarterly disbursals or Rs 23,892 crore managed AUM.
Got a follow-up? Ask IRIS
Did Moneyview’s reported credit-quality indicators improve?
Moneyview reported gross non-performing assets, or GNPA, of 2.42% in Q2 FY27, down 23 basis points year on year and 2 basis points quarter on quarter. Collection efficiency was 98.64%, up 37 basis points year on year and 3 basis points quarter on quarter; one basis point equals one-hundredth of a percentage point.
The reported movement was consistent across the two credit measures: GNPA declined while collection efficiency increased. Moneyview characterises this as improving credit quality and places it alongside Q2 FY27 disbursals of Rs 7,701 crore, but the supplied page does not disclose credit-cost, impairment-charge, write-off or provisioning figures.
Moneyview says its risk assessment models use more than 100,000 data variables through artificial intelligence and machine learning. It also reports 49 financial partners across nine product offerings, although the presentation does not identify GNPA or collection efficiency by product, partner, geography or loan vintage.
What does Moneyview disclose about its platform scale and RoE?
Moneyview reported 149 million registered users and 49 financial partners, while 79% of users were from tier 2 and beyond cities and the average user age was 32 years. These operating metrics describe the platform’s scale, whereas the 27.9% Q2 FY27 RoE is a financial ratio calculated on net worth including the IPO raise.
The platform presents personalised products through a digital self-service interface to users and offers partners market expansion, data-driven user evaluation and operational efficiencies. Moneyview reports a 4.8-star app-store rating and 99.5% PIN-code coverage, but it does not disclose revenue, profitability or managed-AUM contributions from its 149 million registered users or 49 financial partners.
Moneyview’s disclaimer says certain operating metrics may be drawn from internal management systems, are not defined under Indian Accounting Standards and have not been audited or reviewed by an independent agency. That qualification is relevant to figures such as 149 million registered users, while the September 30, 2026 financial information received a limited statutory-auditor review.
Conclusion
Moneyview’s Q2 FY27 result shows PAT of Rs 201 crore growing faster than total income of Rs 1,146 crore, with the company attributing the outcome to operating leverage, disbursal growth and improved credit quality. The accompanying measures moved in the same direction: opex was 34.5% of income, GNPA was 2.42%, collection efficiency was 98.64%, and loan disbursals were Rs 7,701 crore.
What to watch next is an unresolved disclosure matter in the supplied presentation: Moneyview provides no credit-cost, impairment, provisioning or write-off figure to quantify the credit-quality contribution to Q2 FY27 PAT. The company also gives no numerical target for income, PAT, disbursals, GNPA or RoE, while stating that forward-looking statements are subject to risks and uncertainties.