










Muthoot Microfin Limited cuts borrowing cost to 9.93%
Key highlights
- MML's cost of borrowing fell to 9.93% in Q2 FY27 from 10.13% in Q1 FY27.
- Debt-to-equity increased to 3.50 times in Q2 FY27 from 3.34 times in FY26.
- MML reported Rs 1,835.4 crore of liquid funds and HQLA, plus Rs 1,962.5 crore of unutilised term-loan and debenture sanctions.
- Private-sector banks accounted for 51% of MML's H1 FY27 outstanding funding.
powered by IRIS
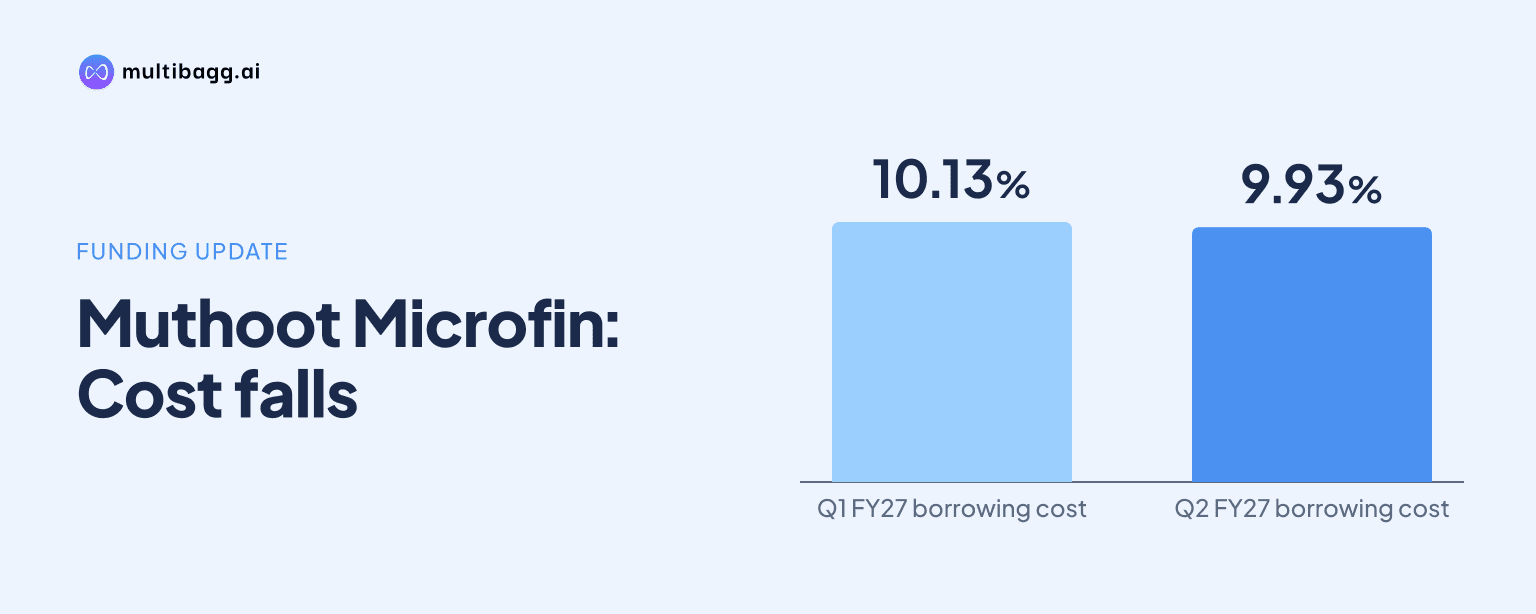
Muthoot Microfin Limited reported a 9.93% cost of borrowing in Q2 FY27, 20 basis points below Q1 FY27, while debt-to-equity rose to 3.50 times and disclosed liquidity resources totalled Rs 6,277.5 crore. MML also reported positive cumulative asset-liability management gaps across every disclosed maturity bucket.
Know Muthoot Microfin inside out
Results, valuation, peers and who's buying, in one view.
How did MML's borrowing cost and leverage change?
MML's reported cost of borrowing fell to 9.93% in Q2 FY27 from 10.13% in Q1 FY27 and 10.27% in FY26. A basis point is one-hundredth of a percentage point. MML also disclosed a marginal cost of funds of 9.69%, which was below the Q2 FY27 reported average cost of borrowing.
Debt-to-equity increased to 3.50 times in Q2 FY27 from 3.42 times in Q1 FY27, 3.34 times in FY26 and 3.01 times in FY25. Net worth rose to Rs 3,056 crore in Q2 FY27 from Rs 2,854.3 crore in FY26, while the capital-to-risk-weighted-assets ratio, or CRAR, increased to 25.5% from 23.9%.
The September 2026 balance sheet shows higher debt alongside loan growth. Borrowings other than debt securities increased to Rs 9,504.61 crore from Rs 8,504.69 crore in March 2026, while debt securities rose to Rs 1,197.63 crore from Rs 1,042.61 crore. Loans increased by Rs 478.44 crore over the six months to Rs 10,874.91 crore.
What are MML's main funding sources?
MML's largest lender category was private-sector banks, which represented 51% of outstanding funding in H1 FY27. Public-sector banks accounted for 17%, foreign banks for 12% and retail investors for 8%; foreign development finance institutions and non-banking financial companies each accounted for 4%.
MML mobilised Rs 5,946.7 crore in H1 FY27, after Rs 9,537.4 crore in FY26 and Rs 7,374.6 crore in FY25. The presentation does not give an H1 FY26 mobilisation figure, so it does not permit a like-for-like first-half comparison. Its disclosed CRISIL ratings were AA-/Stable for long-term, external commercial borrowing and non-convertible debenture facilities, and CRISIL A1+ for commercial paper.
Pass-through certificates, or PTCs, provided Rs 1,721.9 crore in H1 FY27, equal to 29% of incremental borrowing. That compared with Rs 3,289.75 crore and 34% in FY26, meaning other borrowings accounted for 71% of H1 FY27 incremental funding compared with 66% in FY26.
What does MML pay for pass-through certificate funding?
MML disclosed all-in PTC borrowing costs of 7.79% from foreign banks, 8.01% from private-sector banks and 8.50% from public-sector banks. The company said the all-in calculation includes structuring costs and any negative carry on the credit-enhancement portion.
Private-sector banks supplied 92.29% of MML's PTC borrowings, followed by public-sector banks at 5.29% and foreign banks at 2.42%. MML offered first-loss default guarantee, or FLDG, credit enhancement of Rs 89.24 crore on H1 FY27 PTC funding of Rs 1,721.9 crore, compared with Rs 220.83 crore on Rs 3,289.75 crore of PTC funding in FY26.
PTC transaction costs were Rs 80 lakh in H1 FY27, compared with Rs 2 crore in FY26. Management said MML expects to obtain 30% of incremental borrowings through the PTC route, close to the 29% proportion recorded in H1 FY27. The presentation does not disclose a target for total borrowing cost, total annual mobilisation or lender-category mix.
Got a follow-up? Ask IRIS
What liquidity resources and sanctioned lines does MML have?
MML reported Rs 1,835.4 crore of liquid funds and high-quality liquid assets, or HQLA, in its current liquidity position. It separately listed Rs 2,479.6 crore of direct-assignment and PTC sanctions pending, and Rs 1,962.5 crore of unutilised term-loan and non-convertible debenture sanctions. Together, these separately reported resources total Rs 6,277.5 crore.
Cash and cash equivalents increased to Rs 1,567.9 crore in September 2026 from Rs 701.15 crore in March 2026. Bank balances other than cash declined to Rs 394.32 crore from Rs 439.62 crore, while investments increased to Rs 478.09 crore from Rs 405.83 crore. Total financial assets rose to Rs 13,766.18 crore from Rs 12,380.67 crore.
Total financial liabilities were Rs 10,955.49 crore in September 2026, compared with Rs 9,804.37 crore in March 2026. Total equity increased by Rs 201.67 crore to Rs 3,055.98 crore, as other equity rose to Rs 2,888.21 crore from Rs 2,686.55 crore; equity share capital remained Rs 167.77 crore.
Does MML have positive asset-liability gaps across maturities?
MML reported a positive cumulative mismatch in each disclosed static asset-liability management, or ALM, bucket. Static ALM compares assets and liabilities by time band. The cumulative surplus was Rs 1,761.8 crore at one month, Rs 1,405.9 crore at six to 12 months and Rs 3,132.4 crore above one year.
MML's maturity ALM, which compares borrowings with loan assets, was also positive in each disclosed bucket. The cumulative mismatch was Rs 108.5 crore at one month, Rs 420.4 crore at six to 12 months and Rs 2,251.5 crore above one year. The lowest disclosed cumulative maturity mismatch was Rs 98.6 crore in the two-to-three-month bucket.
The two measures differ in their underlying balances. In static ALM, six-to-12-month liabilities of Rs 4,138.6 crore exceeded assets of Rs 3,652.2 crore, but the cumulative mismatch remained positive because of surpluses in earlier buckets. In maturity ALM, borrowings of Rs 3,635.3 crore exceeded loan assets of Rs 3,505.4 crore in the same bucket, while the cumulative position remained positive at Rs 420.4 crore.
Conclusion
MML reduced its reported borrowing cost while expanding balance-sheet funding and increasing debt-to-equity in Q2 FY27. Private-sector banks were the largest funding source, PTCs represented 29% of H1 FY27 incremental borrowing, and the company reported Rs 6,277.5 crore across liquid funds, pending direct-assignment/PTC sanctions and unutilised term-loan and debenture sanctions. Positive cumulative gaps across the disclosed ALM bands provide the stated maturity profile of those resources and obligations.
The next disclosed funding marker is management's expectation that 30% of incremental borrowings will be raised through PTCs. Subsequent results can show whether the PTC share moves from 29% toward that expectation, whether the 9.93% borrowing cost changes, and how the separately reported Rs 1,835.4 crore HQLA and sanctioned funding lines develop.