










Muthoot Microfin GNPA falls to 3.38% as collections rise
Key highlights
- MML’s GNPA ratio declined to 3.38% in Q2 FY’27 from 3.70% in Q1 FY’27.
- Collection efficiency reached 98.11% in Q2 FY’27, compared with 93.34% in Q2 FY’26.
- Stage 2 loans declined to 1.6% in Q2 FY’27 from 4.6% in Q2 FY’26.
- Borrowers unique to MML represented 45.5% of portfolio value in Q2 FY’27.
powered by IRIS
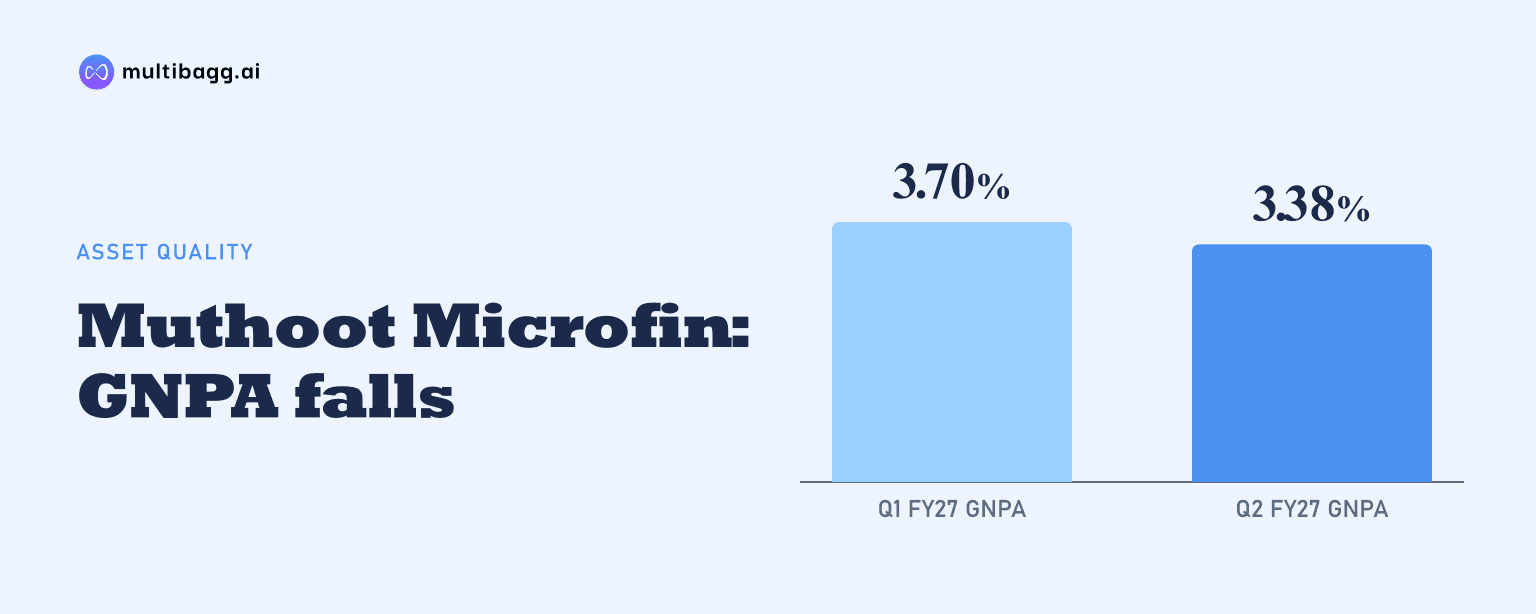
Muthoot Microfin reported a 3.38% gross non-performing asset ratio in Q2 FY’27, down from 3.70% in Q1 FY’27, while collection efficiency reached 98.11% and Stage 2 loans declined to 1.6%. The presentation also shows a larger portfolio share of borrowers unique to MML and lower exposure to borrowers with several other lenders.
Know Muthoot Microfin inside out
Results, valuation, peers and who's buying, in one view.
How did MML’s bad-loan ratio change in Q2 FY’27?
MML’s gross non-performing asset, or GNPA, ratio declined by 32 basis points quarter on quarter to 3.38% in Q2 FY’27, while net NPA, after Stage 3 provisions, stayed at 1.05%. A basis point equals one-hundredth of a percentage point. GNPA had fallen each quarter from 4.85% in Q1 FY’26, reaching 3.89% in Q4 FY’26 and 3.70% in Q1 FY’27.
The improvement occurred as assets under management, or AUM, increased to Rs 15,322.8 crore in Q2 FY’27 from Rs 14,457.2 crore in Q1 FY’27. In Q2 FY’26, MML reported AUM of Rs 12,558.8 crore and GNPA of 4.61%; by Q2 FY’27, AUM was Rs 2,764 crore higher while GNPA was 123 basis points lower.
Did collection performance support lower GNPA at MML?
MML’s collection efficiency, or CE, rose to 98.11% in Q2 FY’27 from 97.97% in Q1 FY’27 and 93.34% in Q2 FY’26. Its overall CE in the X bucket, the company’s stated measure for that bucket, was 99.82% in Q2 FY’27, compared with 99.89% in Q1 FY’27 and 99.29% a year earlier.
Promise-to-pay conversion increased to 66% in Q2 FY’27 from 59% in Q1 FY’27, while conversion against customer visits rose to 83% from 77%. Total collections including closures were Rs 53.5 crore, versus Rs 53 crore in Q1 FY’27. Field-officer collections fell 3% sequentially to Rs 35.5 crore, while agency collections rose 11% to Rs 3 crore and DME collections rose 10% to Rs 15 crore.
MML reported CE of 98.18% for October 2026, above its Q2 FY’27 level. In its stated core markets, Tamil Nadu recorded CE of 100.2% and GNPA of 2.3%, while Kerala recorded CE of 104.0% and GNPA of 1.6%; both GNPA readings were below the pan-India 3.38% figure.
What happened to early-stage stress and provisions at MML?
MML’s Stage 2 loans, defined as 31 to 90 days overdue, declined to 1.6% in Q2 FY’27 from 1.7% in Q1 FY’27 and 4.6% in Q2 FY’26. Stage 3 loans, defined as 90 days or more overdue, fell to 3.4% from 3.7% sequentially and 4.6% a year earlier, alongside the reduction in GNPA.
Stage 1 assets represented 95.00% of gross loan assets in Q2 FY’27, while Stage 2 represented 1.61% and Stage 3 3.38%. Expected credit loss, or ECL, provisions closed at Rs 354.233 crore, down from Rs 408.431 crore in Q1 FY’27. The ECL rate for Stage 1 assets was 0.69%, compared with 0.93% in Q1 FY’27, and Stage 3 ECL coverage was 69.64%, compared with 72.37%.
Total provision coverage on loan assets was 3.15% in Q2 FY’27, while Stage 3 provision coverage was 69.6%. MML reported credit cost of 2.6%, which it described as its lowest level in nine quarters, and other provisions of Rs 24.320 crore in addition to ECL provisions.
Got a follow-up? Ask IRIS
Is MML reducing exposure to borrowers with several lenders?
MML reduced the borrower share with its own loan plus three or more other lenders to 4.3% in Q2 FY’27, from 5.4% in Q1 FY’27 and 10.1% in Q2 FY’26. This borrower category comprised 3.1% with MML plus three other lenders and 1.2% with MML plus four or more. On a portfolio-value basis, those two groups represented 2.3%, down from 3.0% sequentially and 6.6% a year earlier.
Borrowers unique to MML represented 49.6% of customers and 45.5% of portfolio value in Q2 FY’27, up from 46.2% and 44.1% in Q1 FY’27. Their 30-plus-days portfolio-at-risk, or PAR, ratio was 5.24%, compared with 5.94% for borrowers with one additional lender, 7.05% with two, 12.94% with three, and 20.07% with four or more.
The customer mix also moved toward lower indebtedness bands. Borrowers with total indebtedness of up to Rs 50,000 rose to 55.2% in Q2 FY’27 from 45.3% in Q2 FY’26, while the Rs 1 lakh to Rs 1.5 lakh band fell to 13.6% from 17.4%. Borrowers above Rs 2 lakh accounted for 0.7% of borrowers and 1.5% of portfolio value in Q2 FY’27.
How is MML combining portfolio growth with its FY’27 plan?
MML’s Q2 FY’27 disbursements were Rs 2,899.7 crore, compared with Rs 2,644.5 crore in Q1 FY’27 and Rs 2,273.9 crore in Q2 FY’26. Secured AUM increased to Rs 652.6 crore from Rs 219.1 crore sequentially, while unsecured AUM increased to Rs 14,670.2 crore from Rs 14,238.1 crore; unsecured loans remained the larger portfolio category.
Muthoot Small Enterprise Loan, or MSEL, had a Rs 4,161.9 crore portfolio in Q2 FY’27 and disbursed Rs 1,297.6 crore during the quarter. MSEL reported 99.7% CE and 0.02% delinquency at 90-plus days. Management’s FY’27 guidance calls for annualised AUM growth of 18% to 20% and credit cost of 2.5% to 3.0%; actual H1 FY’27 AUM growth was 18.8% and credit cost was 2.6%.
Conclusion
MML’s Q2 FY’27 data combines a lower GNPA ratio with lower Stage 2 and Stage 3 delinquency, higher collection efficiency and continued AUM growth. The borrower data also shows that unique customers had lower 30-plus-days PAR than groups with more outside lenders, while the share of borrowers with three or more other lenders declined.
The next disclosed measures to watch are whether CE remains near October 2026’s 98.18%, whether the 1.6% Stage 2 ratio continues to decline, and whether credit cost remains within management’s 2.5% to 3.0% FY’27 range. Management expects growth to improve in a more productive second half and expects credit cost to improve in H2, making subsequent disbursement, collection and delinquency data relevant to that plan.