










Muthoot Microfin Limited Q2 PAT rises 263% to Rs 110.78 crore
Key highlights
- MML reported Q2 FY27 PAT of Rs 110.78 crore, up 263.0% year on year.
- Total income increased 26.9% year on year to Rs 732.94 crore in Q2 FY27.
- Cost-to-income declined to 48.1% in Q2 FY27 from 59.8% in Q2 FY26.
- Q2 FY27 NIM was 12.5%, while credit cost was 2.6%.
powered by IRIS
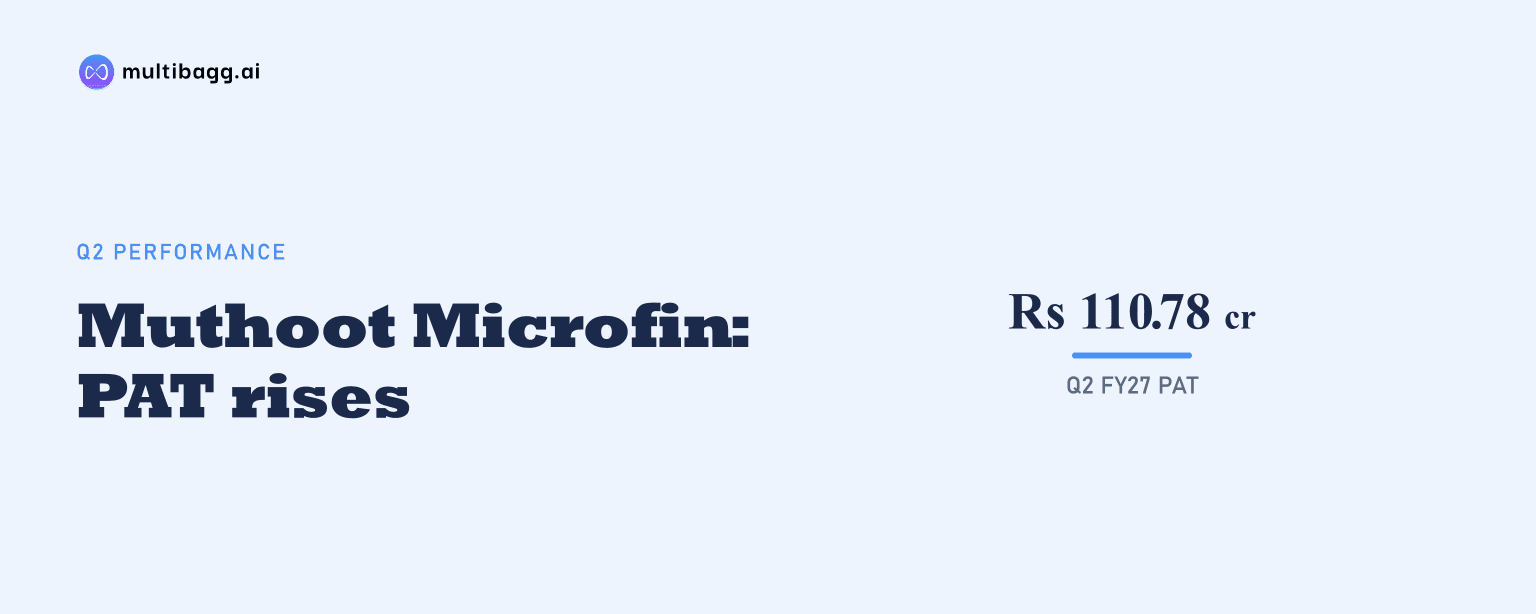
Muthoot Microfin Limited reported Q2 FY27 profit after tax (PAT) of Rs 110.78 crore, up 263.0% year on year from Rs 30.52 crore, as total income rose 26.9% to Rs 732.94 crore and cost-to-income declined to 48.1%. PAT was also 36.2% above Rs 81.34 crore in Q1 FY27.
Know Muthoot Microfin inside out
Results, valuation, peers and who's buying, in one view.
How did MML’s Q2 FY27 profit change?
MML’s Q2 FY27 PAT was Rs 110.78 crore, compared with Rs 30.52 crore in Q2 FY26 and Rs 81.34 crore in Q1 FY27. Profit before tax rose 305.7% year on year to Rs 150.56 crore, while total comprehensive income was Rs 116.48 crore, up 108.4% from Rs 55.90 crore a year earlier. The quarterly PAT sequence was Rs 6.20 crore in Q1 FY26, Rs 30.52 crore in Q2 FY26, Rs 62.40 crore in Q3 FY26 and Rs 71.10 crore in Q4 FY26.
The first-half comparison was also higher. H1 FY27 PAT was Rs 192.12 crore, versus Rs 36.70 crore in H1 FY26, a 423.4% increase. H1 FY27 profit before tax reached Rs 257.17 crore, up 499.9% from Rs 42.87 crore. The reported H1 FY27 PAT exceeded FY26 PAT of Rs 170.30 crore, although the presentation does not give a full-year FY27 PAT target.
What drove MML’s income and margin expansion?
MML reported total income of Rs 732.94 crore in Q2 FY27, up from Rs 577.39 crore in Q2 FY26 and Rs 670.61 crore in Q1 FY27. Revenue from operations rose 26.8% year on year to Rs 730.66 crore, while other income increased to Rs 2.28 crore from Rs 1.06 crore. For H1 FY27, total income was Rs 1,403.55 crore, a 23.5% increase from Rs 1,136.45 crore in H1 FY26.
Net interest margin (NIM) increased to 12.5% in Q2 FY27 from 11.9% in Q2 FY26 and 12.0% in Q1 FY27. Management’s FY27 NIM guidance is 12.3% to 12.5%, while H1 FY27 NIM stood at 12.2%. Management said weighted-average yield is expected to improve further and cost of funds is improving; the reported cost of borrowing was 9.93% in Q2 FY27, versus 10.13% in Q1 FY27 and 10.27% in FY26.
The funding data provides context for the reported borrowing-cost movement. MML reported a marginal cost of funds of 9.69% and said it expects 30% of incremental borrowing through the pass-through certificate (PTC) route. H1 FY27 PTC funding was Rs 1,721.9 crore, representing 29% of the Rs 5,946.7 crore of PTC and other borrowing shown. Private-sector banks accounted for 92.29% of PTC borrowing, with an all-in PTC cost of 8.01%, compared with 8.50% for public-sector banks and 7.79% for foreign banks.
Got a follow-up? Ask IRIS
How did MML control operating and credit costs?
MML’s cost-to-income ratio fell to 48.1% in Q2 FY27 from 59.8% in Q2 FY26 and 53.7% in Q1 FY27. The 5.6-percentage-point sequential decline accompanied 9.3% quarter-on-quarter total-income growth to Rs 732.94 crore. The ratio was also below the FY26 level of 57.0%, while the operating-expense ratio declined to 6.1% from 7.0% a year earlier and 6.3% in Q1 FY27.
Employee benefit expense rose 5.2% year on year to Rs 163.03 crore in Q2 FY27, below the 26.9% increase in total income. Other expenses increased 3.0% to Rs 52.70 crore, while depreciation and amortisation was nearly unchanged at Rs 11.00 crore. Management’s FY27 operating-cost guidance is 6.1% to 6.4%; Q2 FY27 was at the lower boundary and H1 FY27 was 6.2%. Management said operating expenses should rationalise as productivity improves.
Impairment on financial instruments declined 11.7% year on year to Rs 98.80 crore in Q2 FY27, though it rose 7.6% from Rs 91.85 crore in Q1 FY27. The presentation’s credit-cost measure was 2.6% in Q2 FY27, unchanged sequentially and below 3.6% in Q2 FY26. H1 FY27 impairment was Rs 190.65 crore, down 19.6% from Rs 237.24 crore in H1 FY26. Management’s FY27 credit-cost range is 2.5% to 3.0%, and it expects improvement in H2.
Did MML’s profitability and balance-sheet ratios improve?
MML’s PAT return on assets (PAT/ROA) reached 3.0% in Q2 FY27, compared with 1.0% in Q2 FY26 and 2.3% in Q1 FY27. Return on equity (ROE) rose to 14.8%, from 4.6% a year earlier and 11.2% in the preceding quarter. Total comprehensive income return on assets was 3.1%, versus 1.8% in Q2 FY26, alongside quarterly PAT of Rs 110.78 crore.
Total assets were Rs 14,048.35 crore in September 2026, compared with Rs 12,684.81 crore in March 2026, while loans increased to Rs 10,874.91 crore from Rs 10,396.47 crore. Total equity rose to Rs 3,055.98 crore from Rs 2,854.31 crore. The capital-to-risk-weighted-assets ratio was 25.5% in Q2 FY27, compared with 23.9% in FY26, while debt-to-equity increased to 3.50 times from 3.34 times.
Management’s FY27 guidance places ROA at 2.5% to 3.3% and ROE at 12% to 18%. Q2 FY27 ROA of 3.0% and ROE of 14.8% were within those ranges, while H1 FY27 values were 2.6% and 13.0%, respectively. Management attributed its expectation of further ROA improvement to portfolio growth and NIM improvement, and said ROE would improve with overall performance.
Conclusion
MML’s Q2 FY27 earnings recovery combined 26.9% income growth, a 12.5% NIM, lower year-on-year impairment expense and slower growth in employee and other expenses. Total income rose by Rs 155.55 crore from Q2 FY26, PAT increased by Rs 80.26 crore and the cost-to-income ratio declined by 11.7 percentage points, showing changes in both revenue and expense measures versus the prior-year quarter.
The next results will show whether management’s H2 FY27 assumptions are met: more productive asset-under-management growth, further NIM improvement and lower credit cost. Its FY27 guidance calls for 18% to 20% annualised AUM growth, 2.5% to 3.0% credit cost and 6.1% to 6.4% operating cost, while MML expects 30% of incremental borrowing to come through PTCs.