










OBL H1 FY27 revenue rises 41% while debtor levels fall 5%
Key highlights
- OBL reported H1 FY27 revenue of Rs 430.5 crore, up 40.6% year on year.
- OBL said debtor levels declined 5% while H1 FY27 revenue increased 40.6%.
- OBL's DSO fell to 43 days from 48 days in Q4 FY26.
- OBL reported H1 FY27 EBITDA of Rs 40 crore and a 9.3% margin, up 430 basis points.
powered by IRIS
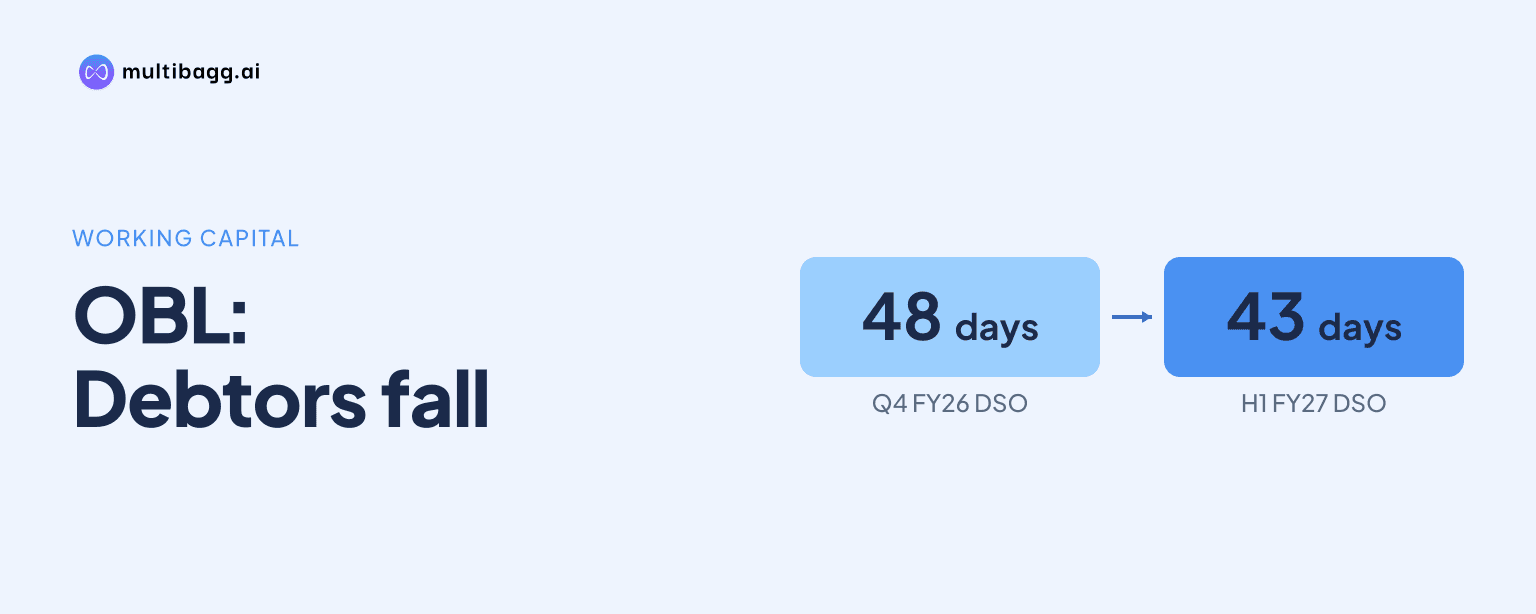
Orient Bell Limited reported H1 FY27 revenue of Rs 430.5 crore, up 40.6% year on year, while debtor levels declined 5% and days of sales outstanding fell to 43 days from 48 days in Q4 FY26. The combination points to improved collections alongside the company’s reported 41% rounded revenue-growth comparison.
Know Orient Bell inside out
Results, valuation, peers and who's buying, in one view.
How did OBL's H1 FY27 revenue and volume change?
OBL's H1 FY27 revenue increased 40.6% year on year to Rs 430.5 crore, supported by volume growth of 18.1%. In Q2 FY27, revenue was Rs 227.6 crore, up 38.8% year on year, while volume rose 14.6%. H1 revenue growth was therefore higher than Q2 revenue growth, and H1 volume growth exceeded the Q2 increase.
Management attributed the sales increase to its focus on secondary sales, or dealer sell-out to customers rather than only sales into dealer channels. It cited 24/7 television advertising, tile-visualisation tools, direct-to-consumer lead generation, learning and development, artificial intelligence-led sales tools and digital market-coverage tracking. In the question-and-answer session, management said industry volume growth excluding OBL was about 1% in H1, compared with OBL's approximately 18% increase.
The Q2 growth mix included about 15% volume growth and about 20% growth in average selling price, according to management. Management said Q2 average selling price was Rs 333, compared with about Rs 320 to Rs 321 in Q1, following the last price increase in July. It also said the projects-to-retail sales ratio remained about 20:80, defining a project as sales of more than 3,000 square metres in a quarter.
Did OBL improve collections and working-capital management?
OBL improved its collection metrics in H1 FY27, with debtor levels declining 5% despite 40.6% revenue growth and days of sales outstanding, or DSO, falling to 43 days from 48 days in Q4 FY26. Management said these movements reflected improved collection efficiency and disciplined working-capital management as first-half revenue reached Rs 430.5 crore.
The working-capital cycle reduced to 18 days from 20 days in March 2026. The two-day improvement in the cycle came alongside the five-day reduction in DSO from Q4 FY26. Management linked the result to tighter working-capital controls and operational efficiency, but did not disclose inventory days, creditor days or absolute debtor balances.
Management said the secondary-sales approach is intended to reduce reliance on competing for dealer orders through additional credit and discounts. It said OBL instead supports dealer sell-out through digital tools and retained Q2 price gains even as Morbi tile rates declined sharply from Q1. This is management's explanation for growing sales without a proportionate increase in credit, rather than a disclosed receivables schedule.
Got a follow-up? Ask IRIS
What happened to OBL's profitability in H1 FY27?
OBL reported H1 FY27 earnings before interest, tax, depreciation and amortisation, or EBITDA, of Rs 40 crore and an EBITDA margin of 9.3%, up 430 basis points year on year. Q2 FY27 EBITDA was Rs 22.4 crore, with a 9.8% margin and a 380-basis-point expansion. The Q2 margin was therefore 0.5 percentage points above the H1 margin.
Profit before tax, or PBT, was Rs 16.4 crore in Q2 FY27, up 326% year on year. For H1 FY27, management said PBT grew 741% year on year, although the transcript describes the H1 PBT figure as “27.6%” rather than providing a currency amount. Management attributed the profitability improvement to operating leverage, improved realisation, premiumisation and manufacturing efficiencies.
The disclosed data show that OBL increased revenue, EBITDA and margin while reporting lower debtor levels in H1 FY27. However, management did not provide a prior-year H1 revenue figure, an absolute debtor balance or an H1 PBT amount in currency terms during the call. Those gaps prevent calculation of net working capital or conversion of PBT growth into cash generation from the transcript alone.
What is OBL doing to sustain operating momentum?
OBL is pursuing capacity, product and brand measures while management expects near-term market volatility to persist. Capacity utilisation reached 75% in Q2 FY27, and OBL converted 1.2 million square metres of ceramic capacity into glazed vitrified tiles, or GVT, in October 2026. Management said the conversion would strengthen its portfolio in a higher-value-added segment.
OBL invested about Rs 1.1 crore to add 1 megawatt of renewable-energy capacity at its Dora facility. Management said the addition means all manufacturing facilities are powered by green energy. In South India, where management said OBL is underrepresented, the company began advertising on two Tamil television channels and one Kannada channel and added dealer displays and shop-in-shop placements over the previous six to eight months.
Management said the geographical revenue split was approximately 49% for North and Central India, 24% for East, 19% for South and 7% for West. It said growth was broadly similar across regions, while its plan is to increase South sales through brand awareness and ground presence. Management also cited volume growth in cement and steel as a positive leading indicator for tiles, while cautioning that market volatility may continue.
Conclusion
OBL combined 40.6% H1 FY27 revenue growth with a 5% decline in debtor levels, DSO of 43 days and an 18-day working-capital cycle. The reported figures show sales and EBITDA expansion alongside tighter credit and collection metrics, with management attributing the outcome to secondary-sales execution, pricing and digital tools.
The next items to watch are management's expectation that H2 has historically been better than H1, its stated objective of reaching a double-digit EBITDA margin, and the effect of the October 2026 conversion of 1.2 million square metres to GVT capacity. Management has not provided formal guidance and continues to flag near-term volatility, including uncertainty around energy costs and tile-market conditions.