










Orient Bell Limited Retains Q2 Prices as Morbi Cuts Rates
Key highlights
- OBL reported Q2 FY27 ASP of Rs 333 per square metre, up Rs 12 sequentially from about Rs 320 to Rs 321.
- Management said higher ASP contributed about 60% of Q2 FY27 growth, while volume contributed about 40%.
- Q2 FY27 EBITDA was Rs 22.4 crore and EBITDA margin was 9.8%, up 380 basis points year on year.
- OBL converted 1.2 million square metres of ceramic capacity into GVT capacity in October 2026.
powered by IRIS
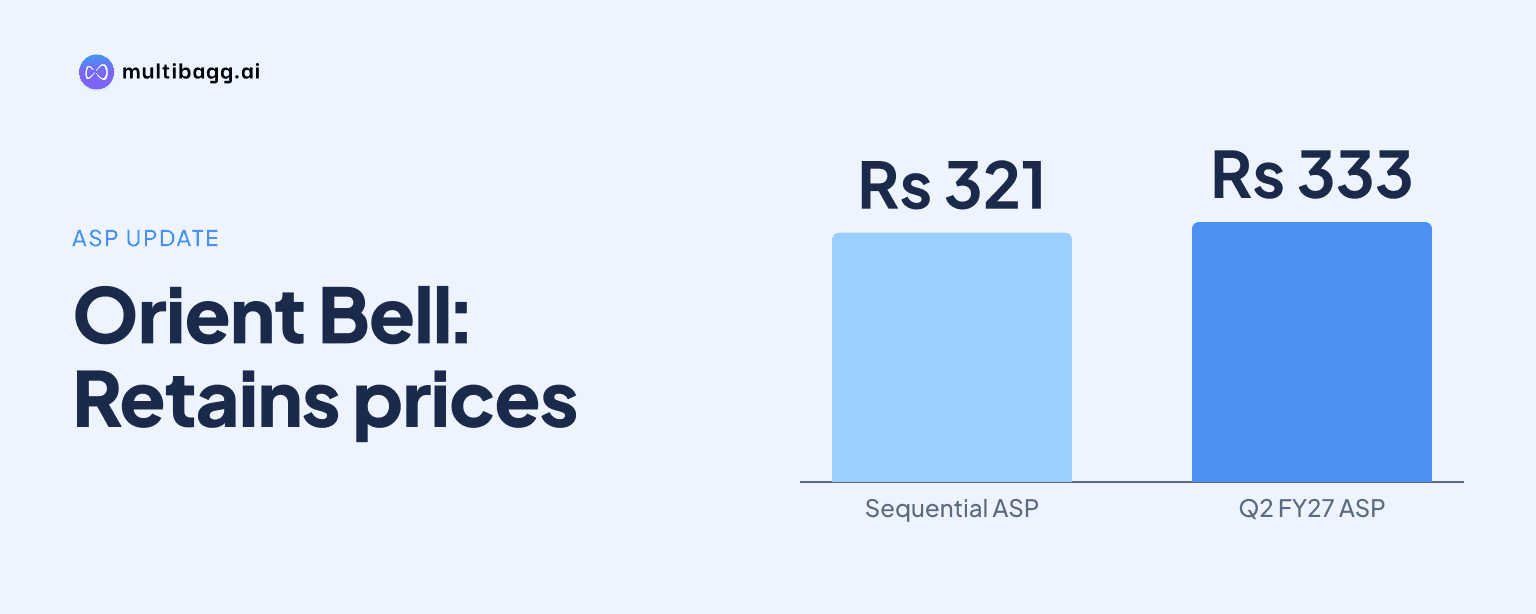
Orient Bell Limited said it retained Q2 FY27 price gains as average selling price reached Rs 333 per square metre, up Rs 12 sequentially from about Rs 320 to Rs 321 in Q1, despite rate reductions by Morbi tile producers in July and August. Management attributed about 60% of quarterly growth to higher pricing.
Know Orient Bell inside out
Results, valuation, peers and who's buying, in one view.
Did OBL hold prices despite Morbi's rate cuts?
Yes. OBL said Q2 FY27 average selling price, or ASP, was Rs 333 per square metre, compared with about Rs 320 to Rs 321 per square metre in Q1 FY27. Management said its last price increase was in July and that the company had retained the gains from progressive price increases taken during Q1.
Management contrasted its pricing with Morbi producers, which it said increased rates aggressively in May and June when demand exceeded supply. In July and August, after supply was restored, Morbi producers gave price reductions and surrendered an estimated 50% to 60% of their earlier gains, while OBL said it maintained its selling rates.
OBL described the tile market as highly volatile over the preceding six months. Management said Q1 had featured demand chasing constrained supply, while Q2 had reversed to supply chasing demand. It said the company's Q2 revenue and volume growth was achieved after Morbi prices had already fallen from their June levels.
How much of OBL's Q2 growth came from pricing?
OBL said about 60% of Q2 FY27 growth came from higher ASP and about 40% from volume. Management described the underlying movements as about 20% ASP growth and about 15% volume growth, making price retention a larger stated contributor to growth than volume in the quarter.
For H1 FY27, OBL said its volume rose about 18%, compared with industry volume growth of about 1% excluding OBL. Management also compared its H1 top-line growth of about 40% with an estimated 24% to 25% for the industry, saying the figures pointed to market-share gains despite the industry's large unorganised and Morbi presence.
The retail-to-project sales ratio remained about 80:20 in Q2 FY27, according to management. OBL defines a project as a sale of more than 3,000 metres in a quarter, and said it exited certain very large projects where margins and credit periods did not meet its requirements, replacing them with mid-sized and smaller projects.
Why does OBL believe it retained pricing?
OBL attributed its performance to a secondary-sales approach focused on dealer sell-out rather than only primary sales to dealers. Management said teams use digital tools to help dealers sell through inventory, an approach intended to reduce the dependence on credit and discounts associated with sales made only into dealer channels.
The company linked this execution model with lower credit exposure. Days sales outstanding, or DSO, declined to 43 days from 48 days in Q4 FY26, while H1 FY27 revenue rose 41% year on year and debtor levels fell 5%, according to management. The working-capital cycle also improved to 18 days from 20 days in March 2026.
OBL said its internal sales system's contribution to overall retail increased to about 45% in Q2 FY27 from about 30% in the previous year. Management did not quantify the system's direct impact on ASP, but presented dealer sell-out, digital tools and tighter credit as mechanisms supporting realisation and demand generation.
North and Central India accounted for about 49% of revenue, followed by East at 24%, South at 19% and West at 7%. Management said growth was broadly similar across regions, but called South underrepresented and said it had advertised on two Tamil television channels and one Kannada channel while expanding dealer displays and shop-in-shop installations over six to eight months.
Got a follow-up? Ask IRIS
What do costs and product mix mean for OBL's margins?
OBL reported Q2 FY27 earnings before interest, tax, depreciation and amortisation, or EBITDA, of Rs 22.4 crore and a 9.8% EBITDA margin, a year-on-year expansion of 380 basis points. H1 FY27 EBITDA was Rs 40 crore at a 9.3% margin, up 430 basis points, which management attributed to operating leverage, higher realisation, premiumisation and manufacturing efficiency.
Gas costs remain an unresolved factor for industry pricing. Management said Morbi manufacturers paid about Rs 67 per cubic metre for propane in July and August, compared with about Rs 83 per cubic metre in November, an increase of almost 20%. OBL said its blended gas cost was around Rs 60 in the quarter, similar to Q1, but gave no formal outlook beyond noting uncertainty over December conditions.
OBL completed the conversion of 1.2 million square metres of ceramic capacity into glazed vitrified tiles, or GVT, in October 2026. Management said GVT revenue salience had risen from about 20% in FY22 and FY23 to 45% currently, and that sales and capacity for the higher-value segment would continue to be expanded.
Overall capacity utilisation reached 75% in Q2 FY27, leaving room for growth from existing infrastructure, management said. The Dora facility operated at about 88% to 89% utilisation, while own-manufacturing gross margin was about 38% to 39%; OBL did not disclose Dora-specific EBITDA because materials move between manufacturing locations.
What is OBL doing beyond tile pricing?
OBL's Masterbond adhesive business generated Rs 3.2 crore in Q2 FY27, up 36% from Rs 2.4 crore in the previous quarter. Management said the business had four manufacturing-unit tie-ups and operated from four dispatch locations in North India and parts of West and East India, with about 80% of sales made on advance payment.
Management said Masterbond, antistatic tiles and foldable tiles were not major contributors to overall sales at this stage. It described the specialised tile products as differentiators for premium customers and said it intended to expand Masterbond through its existing dealer network, without giving a revenue target or timetable.
For the current financial year, OBL expects capital expenditure of around Rs 20 crore, including maintenance spending and the ceramic-to-GVT conversion. Management said it would start annual operating-plan activity in the next two months before outlining next year's capital plan, and indicated that any further GVT expansion was more likely to involve a new greenfield or brownfield line than another ceramic conversion.
Conclusion
OBL's Q2 FY27 result was defined by its stated ability to retain ASP gains while Morbi producers reversed a substantial part of their earlier price increases. The Rs 333 per square metre ASP, management's estimate that pricing delivered about 60% of growth, and the 9.8% EBITDA margin occurred alongside 18% H1 volume growth, lower debtor levels and an 18-day working-capital cycle.
Investors will watch Morbi supply decisions and propane costs after the Diwali break, as management said Morbi gas costs had reached about Rs 83 per cubic metre in November. OBL also plans to resume new showroom additions in H2 and begin annual operating-plan work within two months, after which management expects to provide more detail on capital spending for the next financial year.