










PAKKA H1FY27 operating cash hits Rs 60.6 crore as cash declines
Key highlights
- PAKKA generated Rs 60.6 crore of net operating cash in H1FY27, versus Rs 40.0 crore in H1FY26.
- PAKKA recorded Rs 204.7 crore of net investing outflows in H1FY27 and Rs 127.4 crore of financing inflows.
- PAKKA's cash and cash equivalents declined from Rs 17.9 crore in March 2026 to Rs 1.2 crore in September 2026.
- PAKKA's capital work-in-progress increased to Rs 734.4 crore in September 2026 from Rs 554.7 crore in March 2026.
powered by IRIS
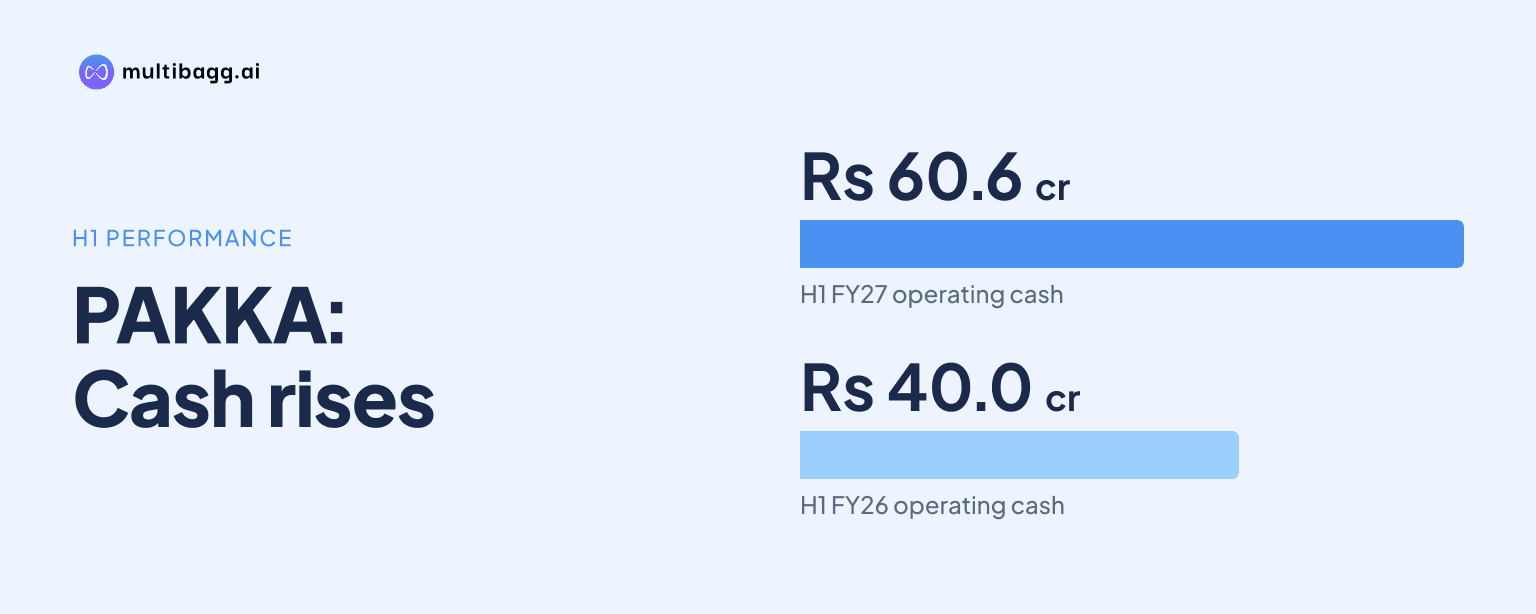
PAKKA Limited generated Rs 60.6 crore of net operating cash in the first half of financial year 2027, H1FY27, up from Rs 40.0 crore a year earlier, but Rs 204.7 crore of investing outflows exceeded that inflow and, despite Rs 127.4 crore of financing inflows, reduced cash and cash equivalents to Rs 1.2 crore in September 2026.
Know Pakka inside out
Results, valuation, peers and who's buying, in one view.
What drove PAKKA's H1FY27 operating cash flow?
PAKKA generated Rs 60.7 crore of cash from operations in H1FY27 and paid Rs 0.1 crore in direct taxes, producing Rs 60.6 crore of net cash from operating activities. That was Rs 20.6 crore higher than the Rs 40.0 crore recorded in H1FY26. The measure is cash after direct taxes rather than the accounting profit reported in the income statement.
The cash-flow statement presents profit before tax (PBT) of Rs 17.7 crore in H1FY27 before a one-time exceptional item. The presentation says reported PBT was Rs 13.0 crore after a Rs 4.7 crore loss on disposal of property, plant and equipment, representing the difference between carrying amount and net disposal proceeds. Profit after tax (PAT) was Rs 9.1 crore, compared with Rs 5.2 crore in H1FY26, while operating cash rose more than PAT.
Revenue from operations increased 52.6% year on year to Rs 241.2 crore in H1FY27 from Rs 158.1 crore in H1FY26. Earnings before interest, tax, depreciation and amortisation (EBITDA), excluding other income, increased to Rs 33.0 crore from Rs 16.2 crore, while EBITDA margin rose to 13.7% from 10.3%. The presentation does not provide a line-by-line reconciliation of working-capital movements behind the operating-cash change.
How did investing and financing affect PAKKA's cash balance?
PAKKA's Rs 204.7 crore H1FY27 net cash outflow from investing activities exceeded its Rs 60.6 crore operating inflow, while financing activities supplied Rs 127.4 crore. Operating and financing cash together totalled Rs 188.0 crore, leaving a Rs 16.7 crore net decrease in cash and cash equivalents. The presentation labels the investment figure as a net outflow but does not split it into individual asset purchases or other investments.
PAKKA began H1FY27 with Rs 17.9 crore of cash and cash equivalents and ended it with Rs 1.2 crore. In H1FY26, it began with Rs 65.2 crore and ended with Rs 19.5 crore after a Rs 45.7 crore reduction. Financing inflows increased by Rs 38.8 crore year on year, while investing outflows increased by Rs 30.4 crore, narrowing the fall in cash equivalents despite the lower opening balance in H1FY27.
The September 2026 balance sheet separately reports Rs 11.4 crore of bank balances other than cash and cash equivalents, compared with Rs 4.2 crore in March 2026. Those balances are separate from the Rs 1.2 crore closing cash-and-cash-equivalents line in the cash-flow statement. The cash-flow movement specifically tracks cash and cash equivalents from Rs 17.9 crore to Rs 1.2 crore.
Got a follow-up? Ask IRIS
How does PAKKA's operating cash compare with earlier years?
PAKKA's H1FY27 operating cash of Rs 60.6 crore was below the Rs 73.7 crore recorded for the full financial year 2026, FY26, but exceeded the Rs 53.1 crore generated in FY24 and Rs 23.3 crore in FY25. The comparison is not like for like because H1FY27 covers six months while FY24, FY25 and FY26 each cover a full year. Still, the interim operating-cash figure approached the FY26 full-year result.
The annual series changed before H1FY27. Net operating cash fell from Rs 53.1 crore in FY24 to Rs 23.3 crore in FY25, then rose to Rs 73.7 crore in FY26. Over those three years, revenue was Rs 404.7 crore in FY24, Rs 406.0 crore in FY25 and Rs 355.8 crore in FY26, indicating that the disclosed operating-cash movement did not follow revenue direction alone.
In FY26, PAKKA generated Rs 84.8 crore of cash from operations and paid Rs 11.1 crore of direct taxes, resulting in Rs 73.7 crore of net operating cash. That year's investing outflow was Rs 366.2 crore and financing inflow was Rs 245.2 crore, producing a Rs 47.3 crore decrease in cash equivalents. The H1FY27 pattern is similar because investment spending exceeded operating cash, although the half-year investing outflow was below the FY26 full-year amount.
What does PAKKA's balance sheet show about expansion funding?
PAKKA reported capital work-in-progress of Rs 734.4 crore in September 2026, up Rs 179.7 crore from Rs 554.7 crore in March 2026. Total non-current assets increased to Rs 1,057.9 crore from Rs 885.4 crore, while property, plant and equipment declined to Rs 195.4 crore from Rs 204.9 crore. The increase in work-in-progress identifies a larger amount of projects not yet classified as completed property, plant and equipment.
Non-current borrowings increased to Rs 448.8 crore in September 2026 from Rs 307.9 crore in March 2026, while current borrowings fell to Rs 90.6 crore from Rs 149.2 crore. Total borrowings therefore increased to Rs 539.4 crore from Rs 457.1 crore. This balance-sheet movement occurred alongside the Rs 127.4 crore financing cash inflow reported in H1FY27, although the presentation does not identify every financing transaction.
Total equity rose to Rs 565.5 crore in September 2026 from Rs 506.4 crore in March 2026, while total liabilities increased to Rs 730.5 crore from Rs 645.7 crore. Total assets reached Rs 1,296.0 crore, compared with Rs 1,152.1 crore six months earlier. The balance sheet expanded during a period in which cash and cash equivalents declined, alongside higher non-current assets, investing outflows and financing inflows.
Conclusion
PAKKA's H1FY27 figures combine higher operating cash generation, with net cash from operations rising to Rs 60.6 crore from Rs 40.0 crore, and a substantially larger investing requirement of Rs 204.7 crore. Financing inflows of Rs 127.4 crore covered part of that requirement, but cash and cash equivalents still declined to Rs 1.2 crore as capital work-in-progress increased to Rs 734.4 crore.
The unresolved items in the presentation are the composition of the Rs 204.7 crore investing outflow and the projects represented by the September 2026 capital work-in-progress balance. Future disclosures can show whether operating cash continues to fund a larger share of investing outflows and how borrowings, which rose to Rs 539.4 crore, change alongside project progress.