










Qualiance FY26 revenue had 81% market exposure to Switzerland
Key highlights
- Switzerland accounted for 81% of Qualiance’s FY26 geographical revenue mix, versus 17% for the USA, 2% for the UK and 1% for India.
- Qualiance’s FY26 revenue from operations rose to Rs 77 crore from Rs 53 crore in FY25, while EBITDA increased to Rs 17 crore from Rs 8 crore.
- Qualiance’s FY26 EBITDA margin rose to 21.9% from 15.3%, and PAT margin increased to 15.4% from 9.2%.
- Imported raw materials represented 60% of Qualiance’s FY26 sourcing, while the proposed Tiruppur factory is expected to add 10.8 lakh pieces of annual capacity at a project cost of Rs 39.14 crore.
powered by IRIS
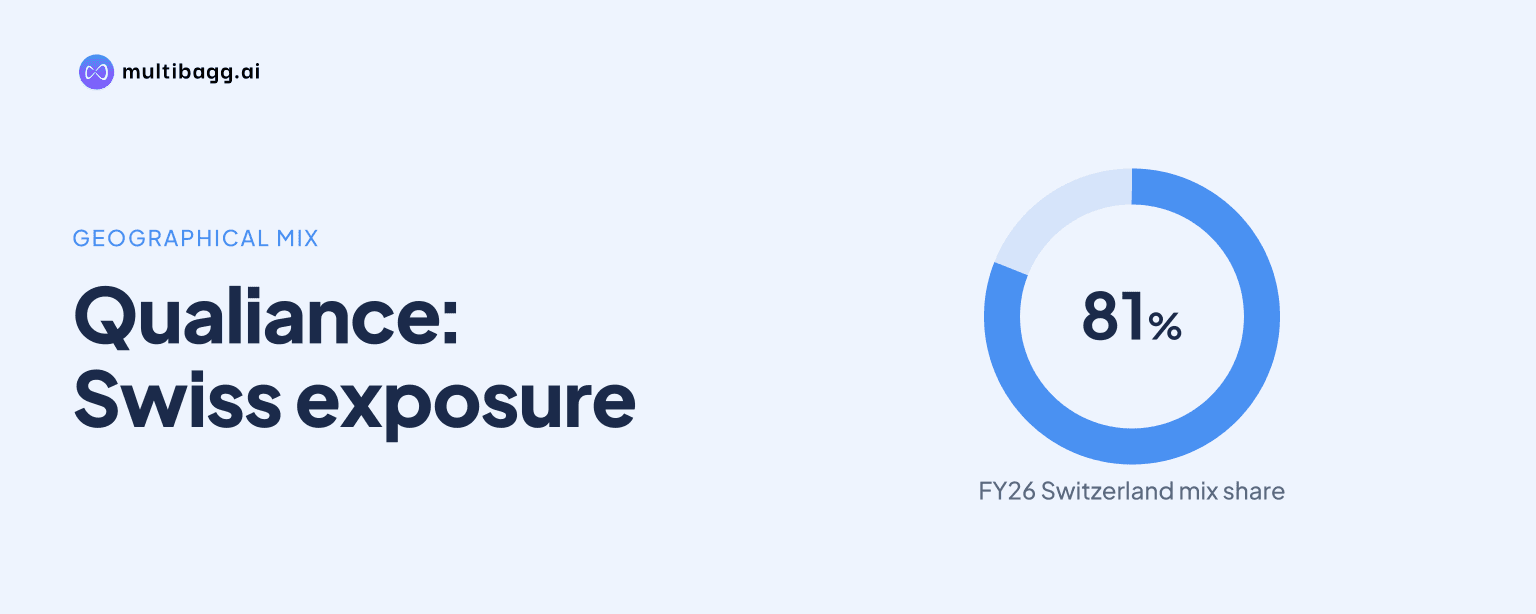
Qualiance reported that Switzerland generated 81% of its FY26 geographical revenue mix, compared with 17% for the USA, 2% for the UK and 1% for India. The concentration accompanied Rs 77 crore in revenue from operations and a procurement mix in which imported raw materials represented 60%.
Know Qualiance International inside out
Results, valuation, peers and who's buying, in one view.
What was Qualiance’s FY26 geographical revenue mix?
Qualiance’s FY26 geographical revenue mix was led by Switzerland at 81%, with the USA at 17%, the UK at 2% and India at 1%. Switzerland was therefore the largest disclosed market, while the USA was the only other geography with a reported share above 2%.
The four percentages listed by Qualiance total 101%, rather than 100%. The presentation does not provide a reconciliation, country-level revenue amounts, customer numbers or a geographical mix for FY24 or FY25, so it does not support a precise calculation of sales by country or a year-on-year market-share comparison.
How concentrated was Qualiance’s FY26 revenue in Switzerland?
Qualiance’s FY26 revenue was concentrated in Switzerland because its reported 81% share was 64 percentage points above the USA’s 17% share. Switzerland’s stated share was also greater than the combined 20% reported for the USA, UK and India, although the presentation’s four individual percentages total 101%.
The stated distribution means that the Swiss market accounted for most of Qualiance’s disclosed FY26 revenue mix, while the UK and India each accounted for 2% or less. Revenue from operations was Rs 77 crore in FY26, but Qualiance does not disclose what portion of that amount corresponds to Switzerland or to any other individual market.
Qualiance identifies market diversification as a priority from FY28 onwards. Its plan is to onboard premium outdoor, performance and workwear brands in Europe and North America through trade fairs, contact with buying offices, sampling programmes for new customers and facility audits; it gives no target for lowering Switzerland’s 81% share by a specified date.
How did Qualiance’s financial performance change through FY26?
Qualiance reported higher revenue and profits through FY26, with revenue from operations rising to Rs 77 crore from Rs 53 crore in FY25 and Rs 37 crore in FY24. Earnings before interest, tax, depreciation and amortisation (EBITDA) reached Rs 17 crore in FY26, compared with Rs 8 crore in FY25 and Rs 5 crore in FY24.
EBITDA margin increased to 21.9% in FY26 from 15.3% in FY25, and PAT margin rose to 15.4% from 9.2%. Gross profit increased to Rs 44 crore from Rs 32 crore, but gross margin declined to 56.7% from 59.6%, showing that the reported EBITDA and PAT margin increases occurred despite a lower gross margin.
Operating cash flow changed from an outflow of Rs 4.5 crore in FY25 to an inflow of Rs 8.2 crore in FY26, after an inflow of Rs 2.8 crore in FY24. At March 2026, trade receivables were Rs 16 crore versus Rs 2.1 crore at March 2025, while inventories declined to Rs 24.1 crore from Rs 29.5 crore and debt-to-equity fell to 0.82 times from 1.22 times.
Got a follow-up? Ask IRIS
How do sourcing, product mix and expansion plans affect Qualiance?
Qualiance sourced 60% of raw materials from imports and 40% domestically in FY26, making imported inputs 20 percentage points higher than domestic inputs. The presentation does not identify the supplier countries, the value of imported materials or whether the sourcing mix changed from FY25.
Woven products represented 72% of Qualiance’s FY26 product mix, compared with 28% for knitted products. The presentation does not split the Rs 77 crore of FY26 revenue, the 21.9% EBITDA margin or the 15.4% PAT margin between woven and knitted products.
Qualiance plans a new factory at Pongupalayam, Avinashi, in Tiruppur district, Tamil Nadu, with 10.8 lakh pieces of annual capacity, described as 2.4 times existing capacity. The project cost is Rs 39.14 crore, comprising Rs 26.09 crore for civil work and Rs 13.05 crore for machinery; it also lists Rs 87 lakh of land funded from internal accruals and Rs 38 crore from the initial public offering.
The proposed four-floor facility has 1.67 lakh square feet of built-up area and 600 planned sewing machines, along with solar power, rainwater harvesting and energy-efficient lights. Qualiance states that land-use conversion was received in July 2026, while the facility is classified as a white-category unit for which no pollution-board consent is required.
Conclusion
Qualiance’s FY26 disclosures show that two elements of its operating profile were concentrated: Switzerland represented 81% of geographical revenue and imports represented 60% of raw-material sourcing. This coincided with revenue increasing from Rs 53 crore in FY25 to Rs 77 crore in FY26, EBITDA rising from Rs 8 crore to Rs 17 crore and PAT increasing from Rs 5 crore to Rs 12 crore.
The next issue to watch is delivery of the Tiruppur expansion and its diversification plan from FY28 onwards. Qualiance’s project schedule lists civil construction from September 2026 to March 2027, machinery installation from January to March 2027, trial runs and certification in April to May 2027, and commercial operations in July 2027, while its separate H2FY27 roadmap refers to commercial operations between March and June 2027.