










Redington reports 15% revenue CAGR, FY26 ROCE at 19.7%
Key highlights
- Redington reported FY26 revenue of Rs 1,19,347 crore, compared with Rs 8,667 crore in FY07.
- Redington states that revenue CAGR since listing was 15%, while EBITDA CAGR was 14%.
- Redington’s ROCE declined from 66.0% in FY22 to 19.7% in FY26.
- Redington reported Q2 FY27 revenue of Rs 43,002 crore, 48% above Q2 FY26.
powered by IRIS
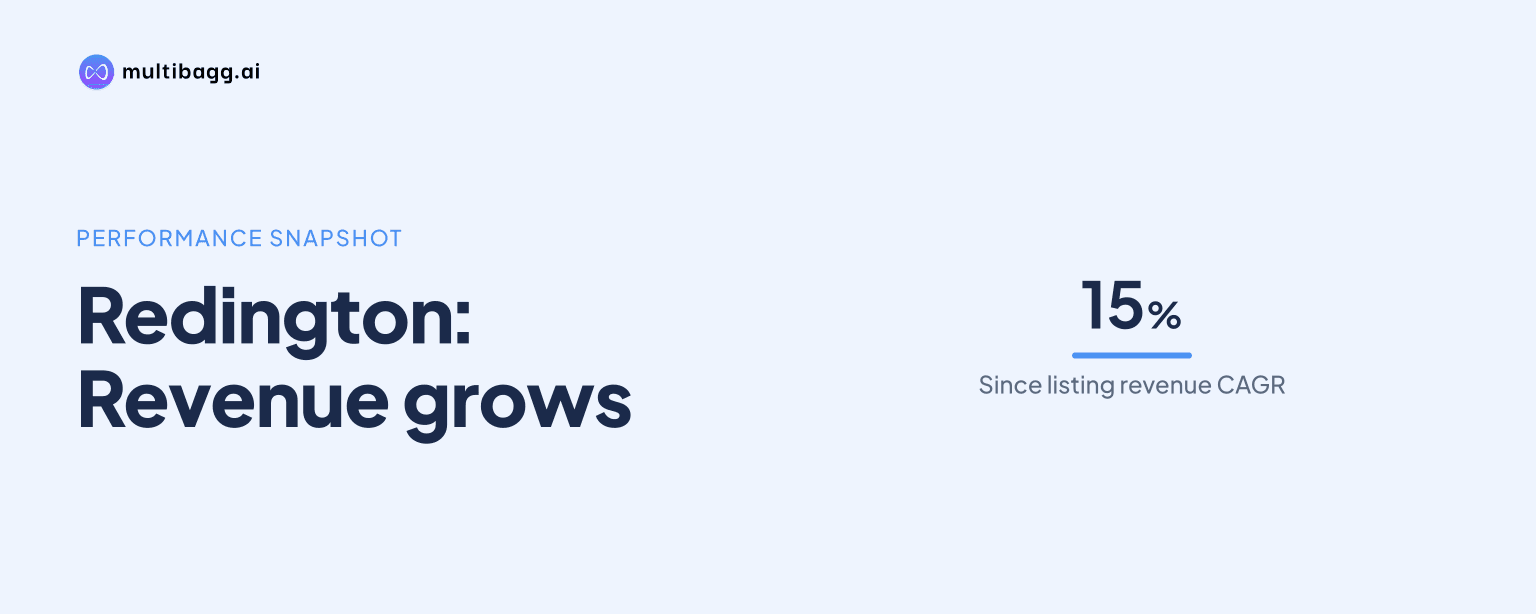
Redington reported a 15% revenue compound annual growth rate since listing, reaching Rs 1,19,347 crore in FY26, while return on capital employed, or ROCE, declined from 66.0% in FY22 to 19.7% in FY26. FY26 earnings before interest, tax, depreciation and amortisation, or EBITDA, were Rs 2,414 crore and profit after tax, or PAT, was Rs 1,565 crore.
Know Redington inside out
Results, valuation, peers and who's buying, in one view.
How fast has Redington grown since listing?
Redington grew revenue at a stated 15% compound annual growth rate, or CAGR, from Rs 8,667 crore in FY07 to Rs 1,19,347 crore in FY26. The series included a decline to Rs 13,162 crore in FY10 from Rs 13,919 crore in FY09, before revenue rose in every reported fiscal year from FY11 through FY26.
The latest five-year period added scale more quickly in absolute terms. Revenue increased from Rs 57,042 crore in FY21 to Rs 62,273 crore in FY22, then to Rs 79,519 crore in FY23, Rs 89,610 crore in FY24, Rs 99,562 crore in FY25 and Rs 1,19,347 crore in FY26. FY26 revenue was therefore Rs 19,785 crore above FY25.
Did Redington’s earnings rise alongside revenue?
Redington’s EBITDA increased at a stated 14% CAGR from Rs 199 crore in FY07 to Rs 2,414 crore in FY26, while PAT after minority interest increased at a stated 15% CAGR from Rs 102 crore to Rs 1,565 crore. Both measures were higher in FY26 than FY25, when EBITDA was Rs 2,257 crore and PAT was Rs 1,340 crore.
The annual earnings path was not uninterrupted. EBITDA rose from Rs 1,879 crore in FY22 to Rs 2,261 crore in FY23, fell to Rs 2,141 crore in FY24, and then recovered to Rs 2,414 crore in FY26. PAT similarly declined from Rs 1,393 crore in FY23 to Rs 1,219 crore in FY24 before reaching Rs 1,565 crore in FY26.
The presentation identifies comparability items in the latest profit figures. FY25 PAT of Rs 1,340 crore excludes profit from the divestment of step-down subsidiary Paynet, while FY26 PAT of Rs 1,565 crore excludes the impact of Arena investment impairment. The source does not quantify those excluded items in the displayed long-term series.
Why did Redington’s ROCE decline after FY22?
Redington’s ROCE fell by 46.3 percentage points from 66.0% in FY22 to 19.7% in FY26. After FY22, ROCE was 36.9% in FY23, 22.5% in FY24 and 21.1% in FY25, before declining further in FY26.
The presentation provides the ROCE sequence but does not give a reason for the movement from FY22. It does not attribute the change to margins, working capital, debt or asset additions, so the source supports the timing and scale of the decline rather than a causal explanation.
Return on equity, or ROE, moved over a narrower range. ROE was 24.1% in FY22, then 22.2% in FY23, 17.0% in FY24, 16.9% in FY25 and 16.8% in FY26, compared with 16.5% in FY21. Thus, FY26 ROE was 7.3 percentage points below FY22, against the 46.3-percentage-point change in ROCE over the same period.
Got a follow-up? Ask IRIS
What happened to Redington’s per-share metrics and payout?
Redington reported earnings per share, or EPS, of Rs 20.0 in FY26, up from Rs 17.1 in FY25 and Rs 15.6 in FY24. The presentation states a 16% EPS CAGR between FY21, when EPS was Rs 9.7, and FY26.
Book value per share was Rs 131 in FY26, compared with Rs 107 in FY25, Rs 95 in FY24 and Rs 55 in FY22. The stated FY21-to-FY26 CAGR for book value per share was 16%, although the measure first fell from Rs 63 in FY21 to Rs 55 in FY22 before increasing in subsequent reported years.
Redington described shareholder payout across the displayed FY21-to-FY26 period as about 42% of profit earned. The payout ratio was 60% in FY21, 40% in each of FY22, FY23 and FY24, 39% in FY25 and 30% in FY26. FY26 payout was therefore 10 percentage points below FY24 and 30 percentage points below FY21.
What does Redington’s Q2 FY27 performance snapshot show?
Redington reported Q2 FY27 revenue of Rs 43,002 crore, up 48% from Rs 29,118 crore in Q2 FY26, while EBITDA rose 41% to Rs 894 crore and PAT rose 50% to Rs 581 crore. The reported debt-to-equity ratio increased to 0.55 times from 0.26 times in the prior-year quarter.
Q2 FY27 ROCE was 22.7%, compared with 20.8% in Q2 FY26, and ROE was 21.6%, compared with 17.2%. The quarterly ROCE was 3.0 percentage points above the FY26 annual ROCE of 19.7%, although the presentation reports the quarterly and annual measures for different periods.
On an Arena-excluded basis, Q2 FY27 revenue was Rs 41,731 crore, EBITDA was Rs 1,003 crore and PAT was Rs 657 crore, compared with Rs 27,112 crore, Rs 637 crore and Rs 425 crore respectively in Q2 FY26. Arena-excluded ROCE rose to 28.0% from 24.4%, while Arena-excluded debt-to-equity rose to 0.45 times from 0.17 times.
Conclusion
Redington’s long-term record shows substantial expansion in revenue and earnings, with revenue rising from Rs 8,667 crore in FY07 to Rs 1,19,347 crore in FY26 and PAT increasing from Rs 102 crore to Rs 1,565 crore. Over the more recent period, however, ROCE decreased from 66.0% in FY22 to 19.7% in FY26, while ROE declined from 24.1% to 16.8%.
The next issue to watch is whether subsequent disclosures clarify the drivers of the FY22-to-FY26 ROCE decline, which the presentation does not explain. Investors can also track whether the Q2 FY27 increase in reported ROCE to 22.7% continues alongside debt-to-equity, which rose to 0.55 times from 0.26 times in Q2 FY26.