










Redington Technology Solutions revenue rises 91% in Q2FY27
Key highlights
- Redington TSG revenue rose 91% year on year to Rs 8,691 crore in Q2FY27.
- SISA TSG revenue increased 115% to Rs 6,553 crore, while ROW revenue rose 42% to Rs 2,139 crore.
- TSG outgrew ESG at 38%, SSG at 39% and MSG at 40% in Q2FY27.
- Redington reported H1FY27 revenue of Rs 77,967 crore, up 41% from Rs 55,120 crore.
powered by IRIS
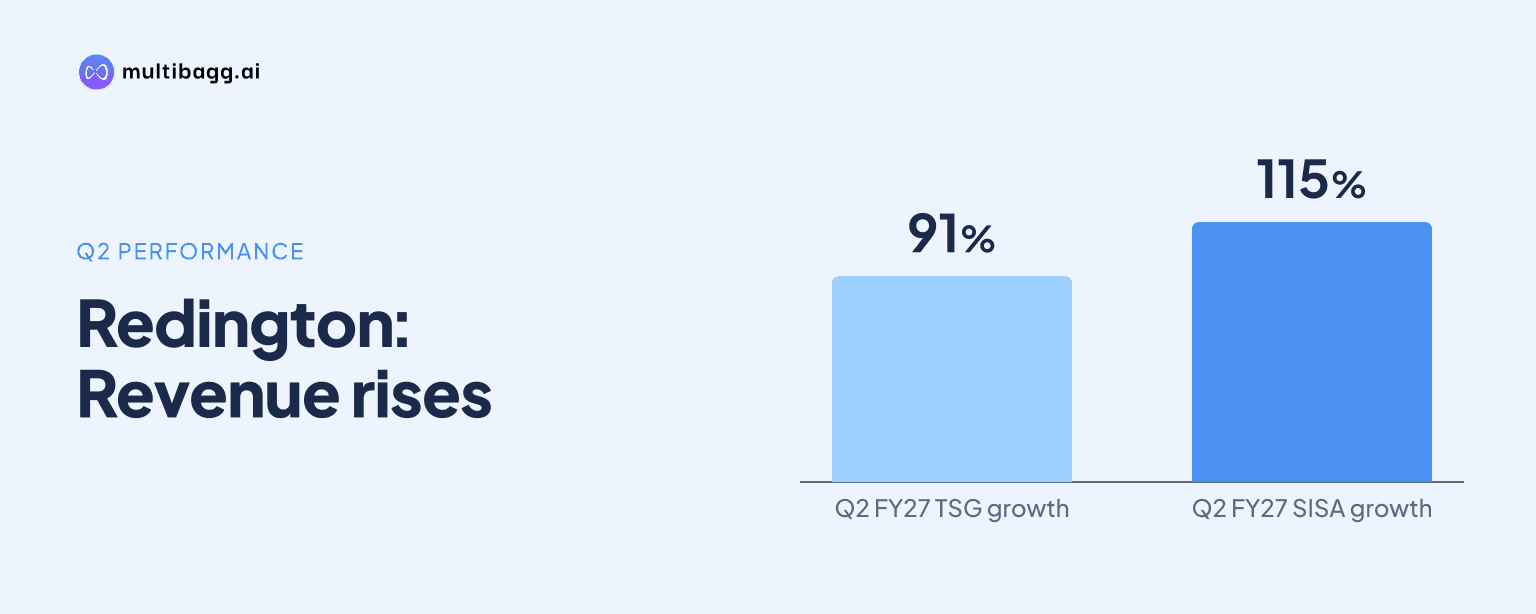
Redington’s Technology Solutions Group (TSG) revenue rose 91% year on year to Rs 8,691 crore in Q2FY27, the highest growth rate among its four largest solution groups. TSG growth was driven by SISA revenue, which increased 115% to Rs 6,553 crore, while Rest of World (ROW) revenue rose 42% to Rs 2,139 crore.
Know Redington inside out
Results, valuation, peers and who's buying, in one view.
How fast did Redington TSG grow in Q2FY27?
Redington TSG revenue increased from Rs 4,548 crore in Q2FY26 to Rs 8,691 crore in Q2FY27, adding Rs 4,143 crore over the year. The vertical covers networking, server and storage, power, and collaboration products, according to Redington’s glossary. Its 91% expansion exceeded the growth recorded by the other three large solution groups.
End Point Solutions Group (ESG) revenue rose 38% to Rs 13,000 crore, Software Solutions Group (SSG) revenue increased 39% to Rs 6,409 crore, and Mobility Solutions Group (MSG) revenue grew 40% to Rs 14,461 crore. TSG therefore grew 51 percentage points faster than MSG, the next-fastest of these four groups, although TSG remained smaller by revenue than ESG and MSG.
Renewable energy had the highest percentage increase among all listed verticals, rising 541% to Rs 111 crore from Rs 17 crore, but it remained much smaller than TSG’s Rs 8,691 crore revenue base. Logistics revenue rose 37% to Rs 372 crore, while Other Services increased 8% to Rs 78 crore in Q2FY27.
Which markets drove Redington TSG growth?
SISA was the main market behind Redington TSG’s increase, with revenue rising 115% to Rs 6,553 crore in Q2FY27 from Rs 3,041 crore in Q2FY26. This was an increase of Rs 3,512 crore, compared with a Rs 632 crore increase in ROW. The regional figures may not add precisely to global revenue because Redington notes that amounts can be affected by intercompany eliminations and rounding.
ROW TSG revenue rose 42% to Rs 2,139 crore in Q2FY27 from Rs 1,507 crore a year earlier. While both markets expanded, the 73-percentage-point difference between SISA and ROW growth shows that the global 91% increase was concentrated more heavily in SISA.
Redington’s overall market mix also shifted toward SISA in Q2FY27. SISA contributed 60% of group revenue, compared with 53% in Q2FY26, while ROW’s revenue contribution declined to 40% from 47%. SISA’s share of group earnings before interest, tax, depreciation and amortisation (EBITDA) rose to 69% from 59%.
How did Redington TSG compare with other verticals?
Redington TSG was the fastest-growing of the four large solution groups, but MSG remained the largest at Rs 14,461 crore in Q2FY27. MSG, which includes smartphones and feature phones, increased 40% from Rs 10,302 crore. ESG was the second-largest group at Rs 13,000 crore after a 38% increase.
TSG’s Rs 8,691 crore revenue placed it above SSG’s Rs 6,409 crore, but below ESG and MSG. The revenue gap between TSG and ESG narrowed to Rs 4,309 crore in Q2FY27 from Rs 4,846 crore in Q2FY26. The gap with MSG was Rs 5,770 crore, compared with Rs 5,754 crore a year earlier, as MSG also expanded.
Regional growth differed among the large solution groups. In SISA, MSG grew 70% to Rs 8,998 crore, compared with 9% growth to Rs 5,462 crore in ROW. ESG rose 42% in SISA and 34% in ROW, while SSG increased 37% and 41%, respectively; TSG’s 115% SISA growth was the highest rate among these groups across the two markets.
Got a follow-up? Ask IRIS
What products are included in Redington TSG?
Redington defines TSG as networking, server and storage, power, and collaboration products. The vertical’s Rs 8,691 crore Q2FY27 revenue was Rs 2,282 crore higher than SSG’s Rs 6,409 crore, which covers cloud and professional services, software licensing and subscriptions, and enterprise security solutions.
Redington does not provide a revenue split for networking, server and storage, power, or collaboration products within the Rs 8,691 crore TSG total. The available disclosure instead identifies market growth: SISA added Rs 3,512 crore of TSG revenue year on year, while ROW added Rs 632 crore.
The presentation separately reports Rs 111 crore of renewable-energy revenue from solar panels and inverters in Q2FY27. It also reports Rs 372 crore of logistics revenue from logistics, warehousing, transportation and value-added services, and notes that logistics and Other Services revenue includes captive revenue.
How does Redington TSG growth fit group performance?
Redington reported H1FY27 revenue of Rs 77,967 crore, up 41% from Rs 55,120 crore in H1FY26. TSG’s 91% increase relates to Q2FY27 alone and is therefore not directly comparable with the group’s six-month revenue growth rate, but it shows that TSG expanded faster than the reported H1 group revenue rate.
For H1FY27, Redington reported gross margin of Rs 3,814 crore, up 35%; EBITDA of Rs 1,645 crore, up 52%; and profit after tax of Rs 1,067 crore, up 61%. These are group-level measures, as the presentation does not disclose TSG-specific gross margin, EBITDA or profit after tax.
Cash-flow data show a different quarterly measure. Redington reported Q2FY27 net cash flow from operations of negative Rs 1,686 crore and free cash flow of negative Rs 1,871 crore, following a Rs 2,568 crore change in working capital. Global working-capital days were 35 in Q2FY27, compared with 31 in Q2FY26.
Conclusion
Redington’s Q2FY27 figures show that TSG was the fastest-growing large solution group, with revenue rising 91% to Rs 8,691 crore. The increase was led by SISA’s 115% growth to Rs 6,553 crore, while ROW grew 42%, and TSG outpaced ESG, SSG and MSG by growth rate despite remaining below ESG and MSG in revenue.
The next disclosure to watch is whether Redington provides product-level TSG revenue or a TSG target, neither of which appears in the presentation. Investors can also track whether TSG’s regional mix changes alongside global working-capital days, which increased to 35 in Q2FY27 from 31 in Q2FY26.