










Redington free cash flow turns negative to Rs 1,871 crore
Key highlights
- Redington reported negative free cash flow of Rs 1,871 crore in Q2FY27, versus positive Rs 1,523 crore in Q2FY26.
- Global working-capital days increased to 35 in Q2FY27 from 31 in Q2FY26.
- ROW working-capital days rose to 39 in Q2FY27 from 32 in Q1FY27.
- Redington Global excluding Arena revenue increased 54% year on year to Rs 41,731 crore in Q2FY27.
powered by IRIS
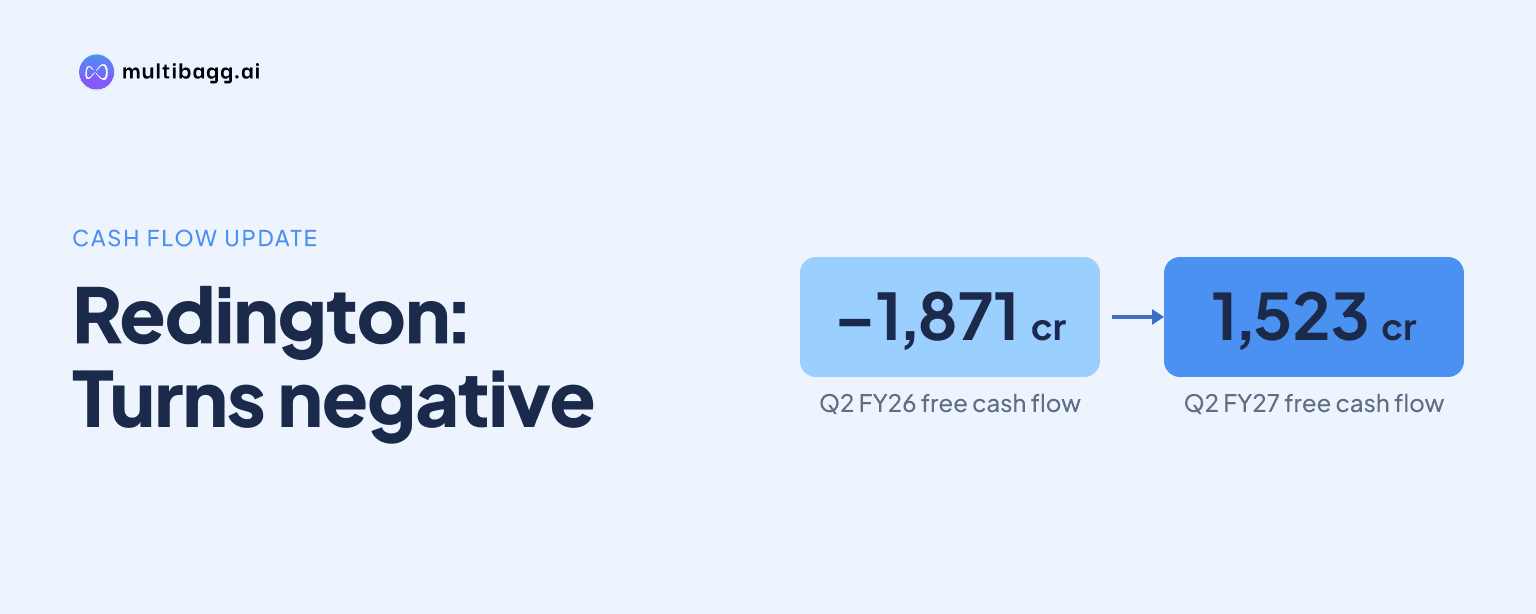
Redington reported negative free cash flow of Rs 1,871 crore in Q2FY27, as global working-capital days rose to 35 from 31 a year earlier and changes in working capital became an Rs 2,568 crore outflow. The result followed positive free cash flow of Rs 1,523 crore in Q2FY26 despite higher profit before taxation.
Know Redington inside out
Results, valuation, peers and who's buying, in one view.
Why did Redington’s Q2FY27 free cash flow turn negative?
Redington’s free cash flow turned negative because an Rs 2,568 crore working-capital outflow drove net cash flow from operations to negative Rs 1,686 crore in Q2FY27. The presentation defines free cash flow, or FCF, as net cash flow from operations, or NCFO, less capital expenditure and finance-cost outflow. Capital expenditure was Rs 72 crore and finance-cost outflow was Rs 113 crore in the quarter, producing negative FCF of Rs 1,871 crore.
The cash-flow result changed sharply from Q2FY26, when Redington reported Rs 1,600 crore of NCFO and Rs 1,523 crore of FCF. Q1FY27 had already moved into negative territory, with NCFO of negative Rs 885 crore and FCF of negative Rs 995 crore. Q2FY27 FCF therefore deteriorated by Rs 876 crore sequentially and by Rs 3,394 crore year on year.
Non-cash items increased to Rs 361 crore in Q2FY27, from Rs 92 crore in Q1FY27 and Rs 62 crore in Q2FY26. Finance cost was Rs 128 crore, compared with Rs 89 crore in the preceding quarter and Rs 116 crore a year earlier. Direct tax paid was negative Rs 231 crore in Q2FY27, versus Rs 147 crore in Q1FY27 and negative Rs 134 crore in Q2FY26.
How did Redington’s working-capital days change by region?
Redington’s working-capital days increased year on year across SISA, ROW and Global in Q2FY27. SISA rose five days to 31 from 26, ROW rose five days to 39 from 34, and Global rose four days to 35 from 31. ROW had the highest day count among the three reported measures at the end of the quarter.
The sequential movements differed by region. SISA was unchanged at 31 days in Q2FY27 and Q1FY27, while ROW increased seven days from 32 to 39 and Global increased three days from 32 to 35. ROW therefore recorded the largest quarter-on-quarter increase, whereas SISA’s year-on-year increase had occurred before Q2FY27.
The longer day counts coincided with the worsening working-capital cash-flow line. Redington reported a positive Rs 1,096 crore change in working capital in Q2FY26, followed by outflows of Rs 1,825 crore in Q1FY27 and Rs 2,568 crore in Q2FY27. The presentation does not provide receivables, inventory or payables balances, so it does not identify the underlying component of the Q2FY27 movement.
Did Redington’s earnings grow while cash flow weakened?
Yes, Redington’s reported Q2FY27 earnings measures rose year on year even as FCF became negative Rs 1,871 crore. Global revenue excluding Arena increased 54% to Rs 41,731 crore, gross margin increased 47% to Rs 1,989 crore, earnings before interest, tax, depreciation and amortisation increased 58% to Rs 1,003 crore, and profit after tax increased 55% to Rs 657 crore.
Profit before taxation rose Rs 164 crore to Rs 624 crore in Q2FY27 from Rs 460 crore in Q2FY26. However, the Rs 2,568 crore working-capital outflow was substantially larger than that year-on-year profit increase and coincided with negative operating cash flow. The presentation shows earnings growth and cash conversion moving in different directions during the quarter.
For H1FY27, Redington reported global revenue of Rs 77,967 crore, up 41% from Rs 55,120 crore in H1FY26. Gross margin rose 35% to Rs 3,814 crore, earnings before interest, tax, depreciation and amortisation rose 52% to Rs 1,645 crore, and profit after tax rose 61% to Rs 1,067 crore. The supplied H1FY27 material does not include a half-year cash-flow statement.
Got a follow-up? Ask IRIS
Which market had the highest working-capital days in Q2FY27?
ROW had Redington’s highest working-capital days at 39 in Q2FY27, compared with 31 for SISA and 35 for Global. ROW’s reading was up from 34 days in Q2FY26 and 32 days in Q1FY27. Its five-day year-on-year increase matched SISA’s increase, while its seven-day sequential rise was the largest reported.
SISA nevertheless remained the larger of the two reported markets by Q2FY27 revenue and profit contribution. SISA revenue grew 66% to Rs 25,660 crore, while ROW excluding Arena revenue increased 38% to Rs 16,071 crore. SISA represented 60% of revenue, 69% of earnings before interest, tax, depreciation and amortisation, and 68% of profit after tax, versus 40%, 31% and 32% respectively for ROW.
The mix had shifted towards SISA from Q2FY26, when it contributed 53% of revenue, 59% of earnings before interest, tax, depreciation and amortisation, and 61% of profit after tax. ROW accounted for 47% of revenue, 41% of earnings before interest, tax, depreciation and amortisation, and 39% of profit after tax in that earlier quarter. Redington does not link this market-mix change directly to the working-capital-day movements.
Which revenue categories grew in Q2FY27?
Redington’s largest global revenue category was Mobility Solutions Group, which rose 40% to Rs 14,461 crore in Q2FY27 from Rs 10,302 crore in Q2FY26. End Point Solutions Group rose 38% to Rs 13,000 crore, Technology Solutions Group rose 91% to Rs 8,691 crore, and Software Solutions Group rose 39% to Rs 6,409 crore.
Technology Solutions Group recorded the fastest growth among the four main global categories, with SISA revenue rising 115% to Rs 6,553 crore and ROW revenue increasing 42% to Rs 2,139 crore. Mobility Solutions Group grew 70% in SISA to Rs 8,998 crore but rose 9% in ROW to Rs 5,462 crore, showing a different market-level growth pattern within Redington’s largest revenue category.
Apple represented 30% of Q2FY27 revenue, up from 29% in Q2FY26. Dell EMC’s share rose to 6% from 4%, and Google’s increased to 5% from 3%; Lenovo declined to 10% from 11% and HP Inc declined to 8% from 9%. Other vendors collectively accounted for 41%, down from 44%.
Conclusion
Redington’s Q2FY27 figures show that profit and revenue growth did not translate into quarterly cash generation. Global working-capital days rose to 35, while the Rs 2,568 crore working-capital outflow led to negative Rs 1,686 crore of operating cash flow and negative Rs 1,871 crore of FCF. At the same time, global revenue excluding Arena increased 54% and profit after tax increased 55%.
The next reporting period should indicate whether Global working-capital days move below 35 and whether FCF recovers from negative Rs 995 crore in Q1FY27 and negative Rs 1,871 crore in Q2FY27. Redington disclosed no working-capital target, cash-flow guidance, or receivables, inventory and payables breakdown in the supplied presentation, leaving the drivers and timing of any reversal unresolved.