










Redington SISA reaches 69% of Q2FY27 EBITDA on 64% growth
Key highlights
- Redington SISA revenue rose 66% to Rs 25,660 crore in Q2FY27.
- Redington reported SISA EBITDA of Rs 613 crore, up 64% year on year.
- SISA’s stated EBITDA contribution increased to 69% in Q2FY27 from 59% in Q2FY26.
- SISA working-capital days were 31 in Q2FY27, compared with 39 days for ROW.
powered by IRIS
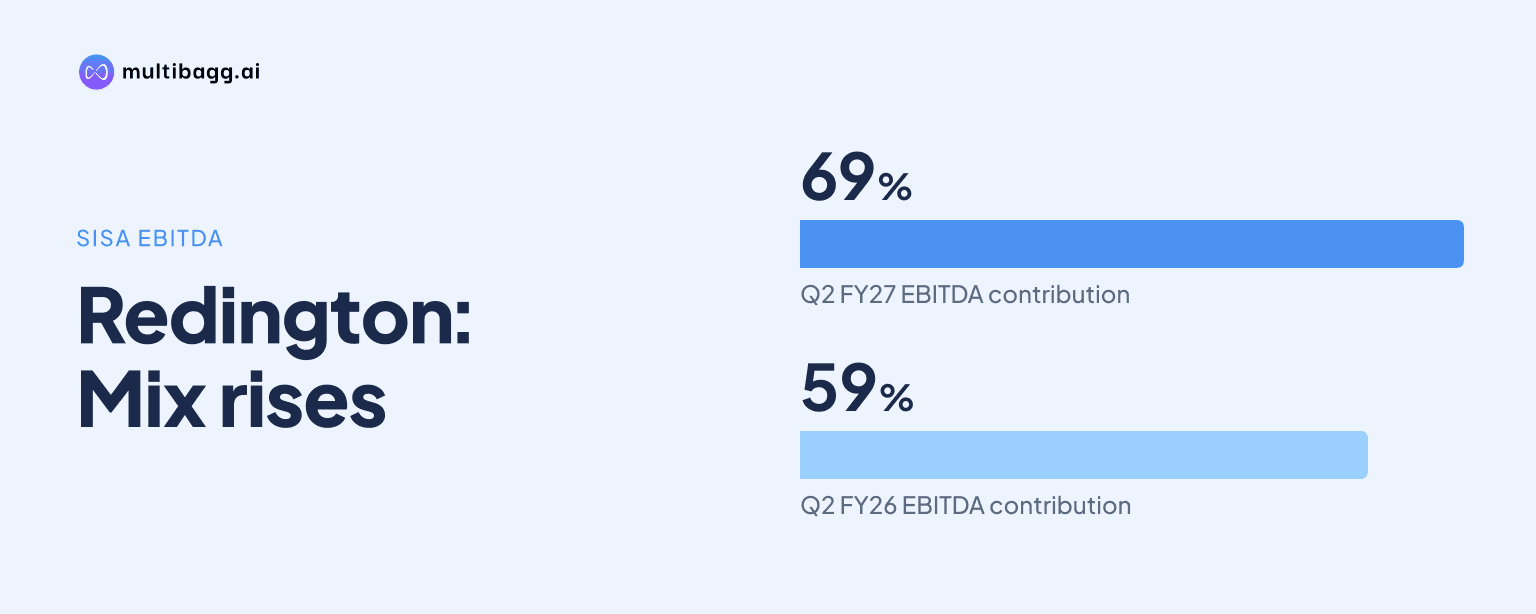
Redington’s SISA business increased revenue 66% to Rs 25,660 crore in Q2FY27 and accounted for 69% of the group’s reported earnings before interest, tax, depreciation and amortisation (EBITDA), up from 59% in Q2FY26. SISA EBITDA rose 64% to Rs 613 crore, compared with 49% growth for ROW excluding Arena.
Know Redington inside out
Results, valuation, peers and who's buying, in one view.
How fast did Redington SISA grow in Q2FY27?
Redington SISA grew faster than ROW excluding Arena across revenue, gross margin (GM), EBITDA and profit after tax (PAT) in Q2FY27. SISA revenue rose by Rs 10,178 crore to Rs 25,660 crore from Rs 15,482 crore in Q2FY26, while GM increased 60% to Rs 1,123 crore and EBITDA increased 64% to Rs 613 crore.
SISA PAT rose 66% to Rs 392 crore from Rs 237 crore. ROW excluding Arena revenue increased 38% to Rs 16,071 crore from Rs 11,630 crore, GM rose 33% to Rs 865 crore, EBITDA increased 49% to Rs 390 crore and PAT rose 41% to Rs 265 crore. SISA’s revenue growth rate was therefore 28 percentage points above the ROW excluding Arena rate.
How did Redington’s geographic earnings mix change?
Redington’s contribution table assigns SISA 69% of Q2FY27 EBITDA, a 10-percentage-point increase from 59% in Q2FY26. The table assigns ROW 31% of EBITDA in Q2FY27, compared with 41% a year earlier, while SISA’s revenue contribution rose to 60% from 53%.
The same movement appears in the other reported contribution measures. SISA represented 53% of GM in Q2FY27 versus 47% in Q2FY26, and its PAT contribution rose to 68% from 61%. ROW’s GM contribution declined to 47% from 53%, while its PAT contribution declined to 32% from 39%.
The market-performance table and the contribution table use different ROW labels. The performance table reports ROW excluding Arena EBITDA of Rs 390 crore, whereas the contribution table labels the counterpart simply as ROW and assigns it 31% of group EBITDA. Redington also reported global EBITDA of Rs 894 crore and global excluding-Arena EBITDA of Rs 1,003 crore for Q2FY27, so the two market presentations should not be treated as being on the same stated basis.
Got a follow-up? Ask IRIS
Which Redington verticals drove SISA revenue growth?
Redington’s Mobility Solutions Group (MSG) and Technology Solutions Group (TSG) generated the largest absolute increases among the main SISA verticals in Q2FY27. MSG revenue rose 70% to Rs 8,998 crore from Rs 5,283 crore, an increase of Rs 3,715 crore. TSG rose 115% to Rs 6,553 crore from Rs 3,041 crore, adding Rs 3,512 crore.
End Point Solutions Group (ESG) remained the largest listed SISA vertical at Rs 6,945 crore after growing 42% from Rs 4,892 crore. Software Solutions Group (SSG) revenue increased 37% to Rs 2,906 crore from Rs 2,126 crore. In ROW, MSG rose 9% to Rs 5,462 crore, while TSG increased 42% to Rs 2,139 crore, compared with SISA growth of 70% and 115%, respectively.
Renewable energy was SISA’s fastest-growing reported vertical in percentage terms, rising 578% to Rs 104 crore from Rs 15 crore, but its revenue remained below the four main technology verticals. Logistics revenue increased 25% to Rs 211 crore and other services rose 2% to Rs 22 crore. Redington notes that logistics and other-services revenue includes captive revenue, and that vertical totals may differ because of intercompany eliminations and rounding.
What happened to Redington’s working-capital days?
Redington reported 31 working-capital days for SISA in Q2FY27, unchanged from Q1FY27 but five days above the 26 days in Q2FY26. ROW working-capital days rose to 39 from 32 in Q1FY27 and from 34 in Q2FY26, leaving ROW eight days above SISA in Q2FY27.
Global working-capital days reached 35 in Q2FY27, compared with 32 in Q1FY27 and 31 in Q2FY26. This four-day year-on-year increase accompanied 48% growth in reported global revenue to Rs 43,002 crore and 41% growth in global EBITDA to Rs 894 crore. On a global excluding-Arena basis, revenue rose 54% to Rs 41,731 crore and EBITDA increased 58% to Rs 1,003 crore.
Conclusion
Redington’s Q2FY27 figures show that SISA was the larger driver of the quarter’s revenue and earnings growth. SISA delivered Rs 25,660 crore of revenue, Rs 613 crore of EBITDA and Rs 392 crore of PAT, while its stated contribution rose across revenue, GM, EBITDA and PAT. ROW excluding Arena also expanded, but at lower growth rates across all four measures.
The next disclosures will matter for whether SISA retains its 69% EBITDA contribution as working-capital days remain at 31 for SISA and rise to 39 for ROW. Readers should also distinguish between the contribution table’s ROW label and the market-performance table’s ROW excluding Arena figures, alongside the reported difference between global EBITDA of Rs 894 crore and global excluding-Arena EBITDA of Rs 1,003 crore.