










RRI's POY became largest segment with Rs 672 crore FY26 revenue
Key highlights
- RRI's POY revenue rose to Rs 672 crore in FY26 from Rs 53 crore in FY23.
- POY accounted for about 57% of RRI's Rs 1,179 crore FY26 segment revenue total.
- RRI's POY installed capacity reached 117,000 metric tonnes in FY26, with 97% utilisation.
- RRI's FY26 EBITDA rose to Rs 63.7 crore and PAT reached Rs 34 crore.
powered by IRIS
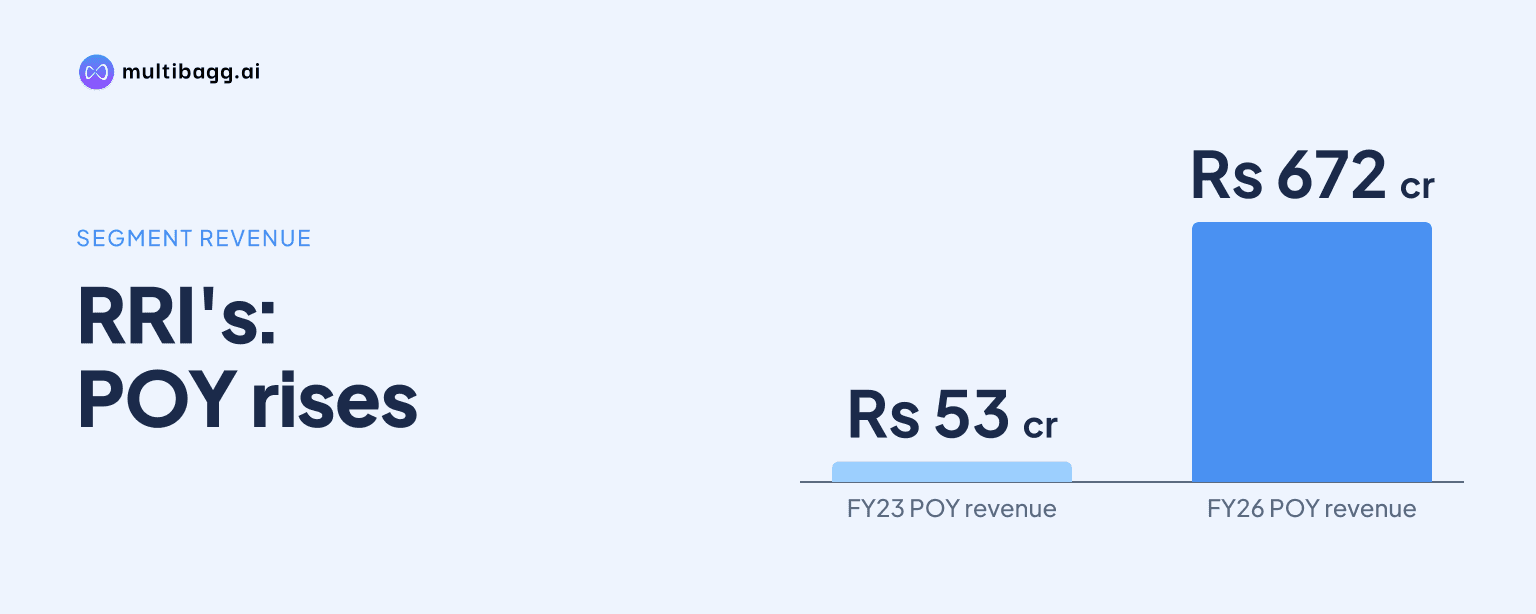
Raj Rayon Industries Limited made POY its largest reported revenue segment in FY26, generating Rs 672 crore versus Rs 53 crore in FY23 and exceeding DTV revenue of Rs 396 crore. The change coincided with POY installed capacity increasing to 117,000 metric tonnes and capacity utilisation reaching 97% in FY26.
Know Raj Rayon Industries inside out
Results, valuation, peers and who's buying, in one view.
How did RRI's product revenue mix change?
RRI's product mix shifted toward POY, which contributed Rs 672 crore of the Rs 1,179 crore segment revenue total in FY26, compared with Rs 53 crore of Rs 134 crore in FY23. Based on the disclosed segment totals, POY accounted for about 57% of FY26 segment revenue, up from about 40% three years earlier.
The shift was not uniform across all reported segments. Polymer/Chips revenue rose from Rs 13 crore in FY23 to Rs 225 crore in FY24, then fell to Rs 120 crore in FY25 and Rs 111 crore in FY26. DTV revenue increased from Rs 68 crore in FY23 to Rs 396 crore in FY26, but its Rs 328 crore increase was below POY's Rs 619 crore rise over the same period.
RRI's segment ranking changed after FY24, when DTV was the largest segment at Rs 294 crore, ahead of POY at Rs 237 crore and Polymer/Chips at Rs 225 crore. POY moved into first place in FY25 at Rs 395 crore, ahead of DTV's Rs 333 crore, and widened its lead to Rs 276 crore in FY26. POY therefore supplied most of the Rs 331 crore increase in total segment revenue between FY25 and FY26.
Why did RRI's POY segment lead FY26 revenue?
RRI's POY segment led FY26 revenue as both sales volume and installed capacity expanded while utilisation remained high. POY sales increased from 1,430 metric tonnes in FY23 to 73,850 metric tonnes in FY26, while installed capacity rose from 7,700 metric tonnes to 117,000 metric tonnes. Utilisation was 94% in FY23 and 97% in FY26.
Capacity allocation moved materially toward POY. POY represented 117,000 metric tonnes of RRI's total installed capacity of 174,000 metric tonnes in FY26, compared with 7,700 metric tonnes of 27,900 metric tonnes in FY23. Polymer/Chips capacity declined from 45,000 metric tonnes in FY24 to 14,000 metric tonnes in FY26, while POY capacity increased by 40,000 metric tonnes from FY25 alone.
POY also drove the latest annual revenue growth. Its revenue increased by Rs 277 crore from FY25 to FY26, compared with a Rs 63 crore increase in DTV revenue and a Rs 9 crore decrease in Polymer/Chips revenue. This shows that FY26's mix change came principally from POY growth rather than an increase across every reported segment.
How did RRI's POY production, sales and capacity change?
RRI produced 113,660 metric tonnes of POY in FY26, up from 72,420 metric tonnes in FY25 and 4,860 metric tonnes in FY23. POY represented about 69% of the company's total FY26 production of 165,530 metric tonnes. Its 41,240-metric-tonne production increase from FY25 was larger than DTV's 7,570-metric-tonne increase.
POY sales reached 73,850 metric tonnes in FY26, up from 42,080 metric tonnes in FY25. DTV sales were 37,170 metric tonnes and Polymer/Chips sales were 14,240 metric tonnes, making POY the largest sales-volume segment. Company-wide sales increased to 125,000 metric tonnes in FY26 from 88,000 metric tonnes in FY25.
RRI reported different utilisation movements in the other segments. Polymer/Chips utilisation rose to 99% in FY26 from 45% in FY25, but its installed capacity was reduced to 14,000 metric tonnes from 32,000 metric tonnes. DTV utilisation declined to 88% from 91%, while DTV capacity increased to 43,000 metric tonnes from 33,660 metric tonnes.
Got a follow-up? Ask IRIS
How did RRI's profitability change as POY expanded?
RRI's revenue from operations increased to Rs 1,179.7 crore in FY26 from Rs 849.4 crore in FY25, while earnings before interest, tax, depreciation and amortisation, or EBITDA, rose to Rs 63.7 crore from Rs 29.5 crore. EBITDA margin increased to 5.4% from 3.5%, after declining from 3.7% in FY24 to 3.5% in FY25. The presentation does not allocate EBITDA or margin by segment.
Profit after tax, or PAT, reached Rs 34 crore in FY26, compared with Rs 13.8 crore in FY25 and a Rs 12.4 crore loss in FY23. PAT margin was 2.9%, up from 1.6% in FY25 and 0.5% in FY24. Gross profit rose to Rs 245.5 crore from Rs 156.9 crore, while gross margin increased to 20.8% from 18.5%.
RRI's company-wide production rose to 165,530 metric tonnes in FY26 from 117,400 metric tonnes in FY25, and total capacity utilisation increased to 95% from 82%. These operating figures accompanied the rise in revenue and margins, although the presentation does not identify the contribution of POY or either other segment to profitability.
What do RRI's returns and working-capital figures show?
RRI reported return on capital employed, or ROCE, of 16.2 in FY26, compared with 8.9 in FY25 and 0.5 in FY23. Return on equity, or ROE, was 21.7 in FY26 after 12.1 in FY25 and negative 44.3 in FY23. Debt to equity declined to 1.2 from 1.9, returning to its FY23 level.
Working-capital days were negative 26 in FY26, compared with positive one day in FY25 and 20 days in FY24. RRI attributes the FY26 result to its non-fund-based raw-material procurement model, under which the production-to-collection cycle is completed within the supplier credit period. The company describes this as a self-funded working-capital structure.
Net cash from operating activities rose to Rs 119.1 crore in FY26 from Rs 36.8 crore in FY25, while net cash used in investing activities was Rs 83 crore after Rs 83.2 crore a year earlier. Property, plant and equipment stood at Rs 342.4 crore at March 2026, up from Rs 212.4 crore at March 2025, providing balance-sheet context for the capacity increase.
Conclusion
RRI's FY26 disclosures show a clear move toward POY as the principal reported revenue segment, with Rs 672 crore of revenue, 117,000 metric tonnes of installed capacity and 97% utilisation. The expansion occurred alongside revenue from operations of Rs 1,179.7 crore, EBITDA of Rs 63.7 crore, PAT of Rs 34 crore and ROCE of 16.2.
The next issue is whether segment disclosures show POY retaining this position in FY27, as the supplied material provides no FY27 segment-wise revenue split or further capacity target. At the company level, Q2FY27 revenue from operations was Rs 456.5 crore and H1FY27 EBITDA margin was 7.6%, compared with 5.3% in H1FY26.