










Sacheerome H1 FY27 PAT rises 12.38% as EBITDA margin expands
Key highlights
- Sacheerome reported H1 FY27 PAT of Rs 16.7868 crore, up 12.38% year on year.
- Sacheerome's H1 FY27 total income increased 9.84% to Rs 85.9198 crore.
- Sacheerome's EBITDA margin rose to 27.57% from 26.98% in H1 FY26.
- Sacheerome commenced trial production at its YEIDA facility in September 2026.
powered by IRIS
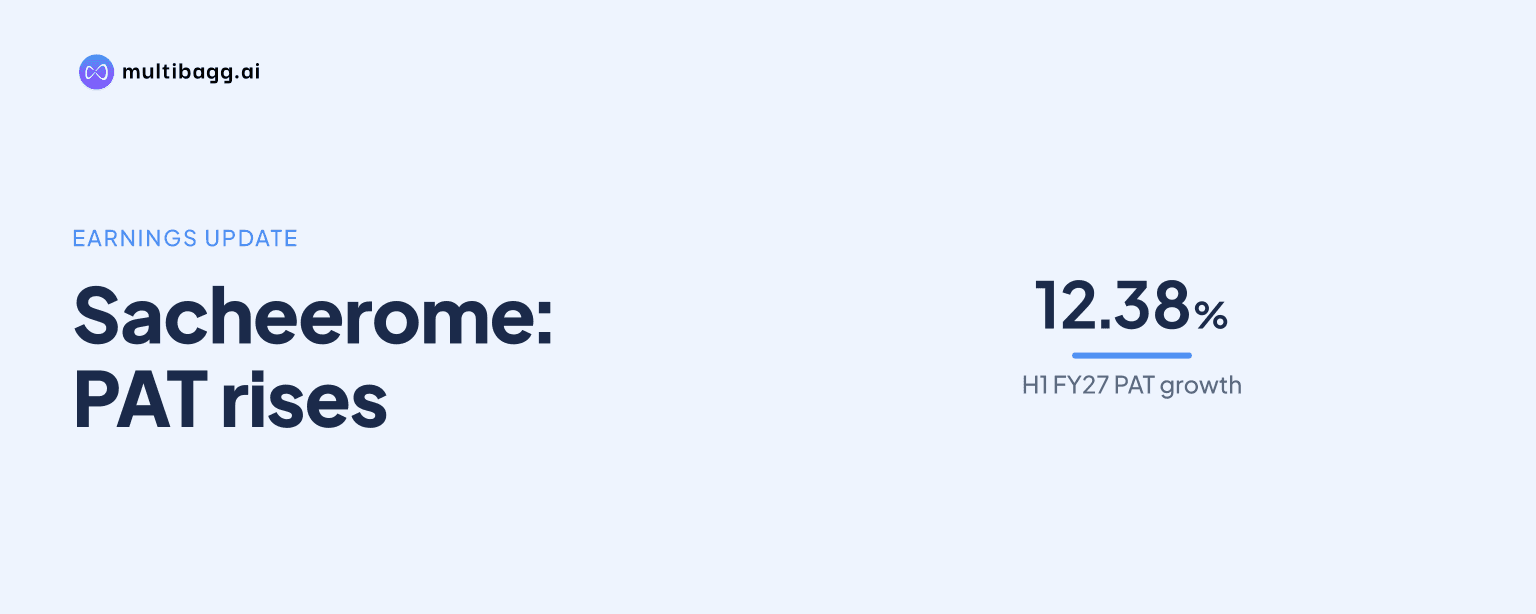
Sacheerome Limited reported profit after tax (PAT) of Rs 16.7868 crore in the first half (H1) of fiscal year (FY) 2027, up 12.38% year on year, as earnings before interest, tax, depreciation and amortisation (EBITDA) rose 12.27% and EBITDA margin increased to 27.57% from 26.98%. Total income grew 9.84% to Rs 85.9198 crore.
Know Sacheerome inside out
Results, valuation, peers and who's buying, in one view.
How did Sacheerome perform in H1 FY27?
Sacheerome increased total income by Rs 7.6962 crore to Rs 85.9198 crore in H1 FY27 from Rs 78.2236 crore in H1 FY26. Revenue, which excludes other income, rose to Rs 84.4842 crore from Rs 76.5650 crore, while other income declined to Rs 1.4355 crore from Rs 1.6586 crore. The reported total-income growth rate was 9.84% for the half year.
EBITDA rose by Rs 2.5889 crore to Rs 23.6915 crore, compared with Rs 21.1026 crore in H1 FY26. PAT increased by Rs 1.8490 crore to Rs 16.7868 crore from Rs 14.9378 crore. Both EBITDA growth of 12.27% and PAT growth of 12.38% therefore exceeded the 9.84% increase in total income.
Why did Sacheerome's profit grow faster than income?
Sacheerome's reported figures show that profit grew faster than income as its EBITDA and PAT margins both increased in H1 FY27. EBITDA margin rose by 0.59 percentage points to 27.57% from 26.98%, while PAT margin increased by 0.44 percentage points to 19.54% from 19.10%. These movements accompany the gap between 9.84% income growth and 12.38% PAT growth.
The presentation does not assign the margin expansion to a specific cost-saving programme, product category or customer. Chairman and Managing Director Manoj Arora said Sacheerome recorded steady income and profitability growth while working with customers on fragrance and flavour solutions suited to their products. Sacheerome serves business-to-business customers across fragrance and flavour applications, but the H1 financial slides do not provide segment-level revenue or profit figures.
At the profit-before-tax (PBT) level, PBT before prior items increased 12.57% to Rs 22.5053 crore from Rs 19.9915 crore. No prior-period item was reported in either H1 FY27 or H1 FY26. Tax rose to Rs 5.7186 crore from Rs 5.0536 crore, after which PAT reached Rs 16.7868 crore for H1 FY27.
How did Sacheerome's costs and non-operating items change?
Sacheerome's total expenditure increased to Rs 62.2283 crore in H1 FY27 from Rs 57.1210 crore in H1 FY26, a rise of Rs 5.1073 crore. Raw-material costs were the largest listed expense and increased by Rs 3.4730 crore to Rs 49.4461 crore. Employee costs rose by Rs 35.40 lakh to Rs 6.4438 crore over the same comparison.
Other expenses, including finance cost other than interest cost, increased to Rs 6.3384 crore from Rs 5.0581 crore, an increase of Rs 1.2803 crore. In contrast, interest costs fell to Rs 3.50 lakh from Rs 7.56 lakh, and depreciation increased to Rs 1.1512 crore from Rs 1.0356 crore. The presentation does not break down the other-expense line further, so the disclosed data does not identify the individual components behind that increase.
The change in other income also matters when comparing revenue with total income. Revenue rose by Rs 7.9192 crore, whereas other income declined by Rs 22.31 lakh, resulting in a total-income increase of Rs 7.6962 crore. EBITDA is presented before the Rs 3.50 lakh of interest costs and Rs 1.1512 crore of depreciation recorded in H1 FY27.
Got a follow-up? Ask IRIS
What do Sacheerome's margin figures show?
Sacheerome generated Rs 27.57 of EBITDA for every Rs 100 of total income in H1 FY27, compared with Rs 26.98 in H1 FY26. Its PAT margin was Rs 19.54 per Rs 100 of total income, up from Rs 19.10. The source presents both margins as percentages alongside total income, EBITDA and PAT for the two half-year periods.
The 0.59-percentage-point EBITDA-margin increase equals 59 basis points, where one basis point is one-hundredth of a percentage point. The 0.44-percentage-point PAT-margin increase equals 44 basis points. These are period-on-period comparisons, not a management target or forecast, and the presentation gives no H2 FY27 margin guidance.
Sacheerome's full-year FY26 reference figures provide broader context but are not directly comparable with a half-year period. For FY26, it reported revenue of Rs 152.3858 crore, EBITDA of Rs 40.6615 crore and PAT of Rs 28.4411 crore. The H1 FY27 presentation also lists FY26 return on equity at 27.04% and return on capital employed at 36.32%, without providing H1 FY27 updates for either measure.
What does the YEIDA plan mean for Sacheerome?
Sacheerome commenced trial production at its new YEIDA facility in September 2026, according to Mr. Arora's H1 FY27 commentary. Management said the facility is intended to provide greater manufacturing capacity and dedicated areas for research, application development and product evaluation. Sacheerome described progressing the facility and serving existing customers better as its immediate focus.
The presentation lists two manufacturing locations, New Delhi and YEIDA, and states annual production capacity of 27,60,000 kilograms. It also states that Sacheerome has 60 research and development specialists and more than 180 employees. Its fragrance activities cover personal care, home care, fabric care, fine fragrances, men's grooming, hygiene and wellness, while flavours cover beverages, bakery, dairy, confectionery, seasonings, oral care, and health and nutrition.
Management also said it intends to build relationships in domestic and international markets. That statement is forward-looking, and the presentation cautions that future performance can differ from forward-looking statements because of risks and uncertainties. No commissioning date, capacity addition at YEIDA, capital-spending amount or revenue contribution target for the facility is disclosed in the supplied H1 FY27 material.
Conclusion
The H1 FY27 figures combine 9.84% total-income growth with margin gains of 0.59 percentage points in EBITDA and 0.44 percentage points in PAT. Costs rose across raw materials, employees and other expenses, while interest costs fell to Rs 3.50 lakh. The presentation establishes the period-on-period financial changes but does not identify a specific operational cause for the margin expansion.
The next disclosed development to watch is progress at the YEIDA facility after trial production began in September 2026. Management has linked the site to additional manufacturing capacity and dedicated research, application-development and product-evaluation spaces, but has not provided a commissioning schedule, investment amount, capacity split or financial target. Future disclosures on these matters would clarify the facility's contribution beyond H1 FY27.