










Shanti Gold revenue nears threefold as debt-equity declines
Key highlights
- Shanti Gold’s FY26 revenue was Rs 2,018.7 crore, compared with Rs 679.4 crore in FY23.
- Shanti Gold’s FY26 EBITDA margin reached 9.86%, up from 6.28% in FY23.
- Shanti Gold’s debt-to-equity ratio declined from 2.37x in FY23 to 0.36x in FY26.
- Shanti Gold reported H1FY27 revenue growth of 102.30% to Rs 1,462.33 crore, while EBITDA margin was 7.79%.
powered by IRIS
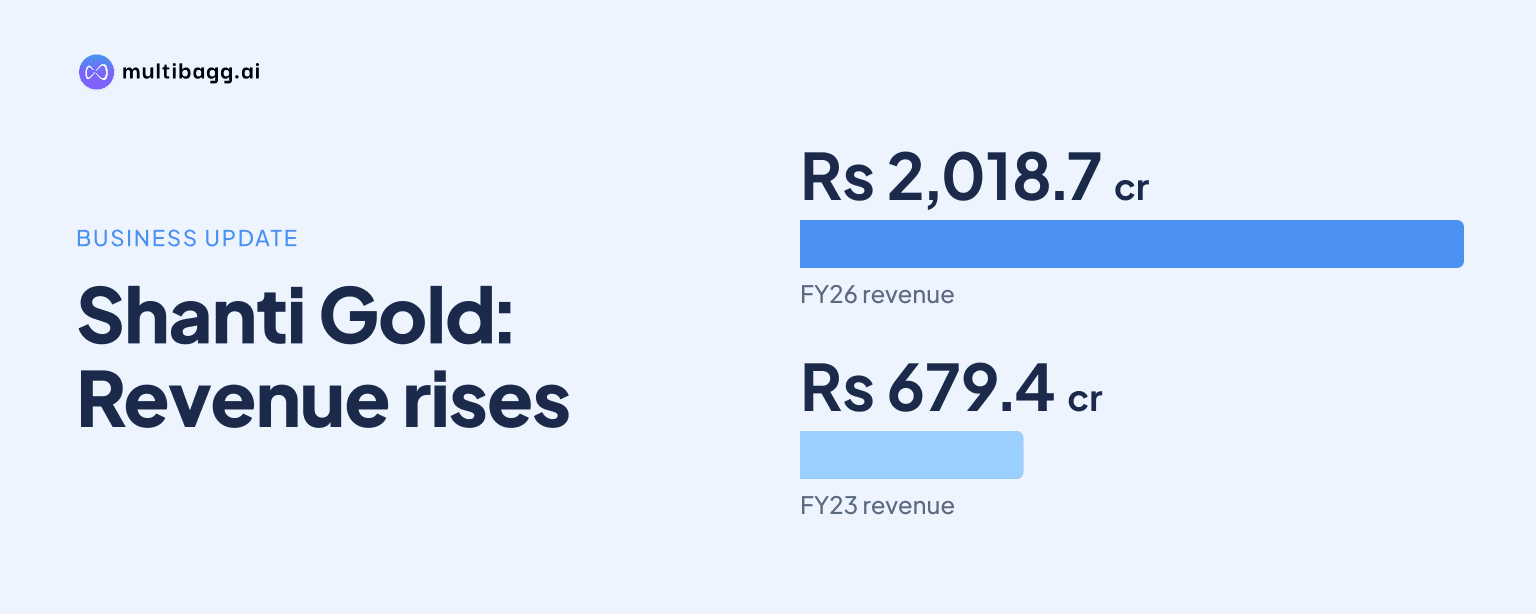
Shanti Gold International Ltd. raised revenue from operations to Rs 2,018.7 crore in FY26 from Rs 679.4 crore in FY23, while its debt-to-equity ratio fell to 0.36x from 2.37x. Over the same period, EBITDA margin increased to 9.86% from 6.28% and net profit rose to Rs 140.2 crore from Rs 19.8 crore.
Know Shanti Gold International inside out
Results, valuation, peers and who's buying, in one view.
How did Shanti Gold’s revenue change from FY23 to FY26?
Shanti Gold’s revenue from operations increased by Rs 1,339.3 crore over FY23 to FY26, reaching Rs 2,018.7 crore from Rs 679.4 crore. The company reported a compound annual growth rate, or CAGR, of 43.7% for the period. Growth was limited in FY24, when revenue was Rs 711.4 crore, before accelerating to Rs 1,106.4 crore in FY25 and Rs 2,018.7 crore in FY26.
The FY26 annual increase was 82.46%, from Rs 1,106.41 crore in FY25 to Rs 2,018.71 crore. Cost of materials consumed rose to Rs 1,995.30 crore from Rs 1,016.96 crore, while changes in inventories were Rs (195.66) crore, compared with Rs (16.05) crore in FY25. These reported income-statement movements occurred before EBITDA, or earnings before interest, tax, depreciation and amortisation.
The first half of FY27 showed faster revenue growth than earnings growth. H1FY27 revenue was Rs 1,462.33 crore, up 102.30% from Rs 722.85 crore in H1FY26, while EBITDA rose 29.22% to Rs 113.97 crore. This differed from FY26, when EBITDA increased 121.31%, faster than the 82.46% increase in revenue.
How much did Shanti Gold’s profitability improve by FY26?
Shanti Gold’s EBITDA increased to Rs 199.0 crore in FY26 from Rs 42.7 crore in FY23, and its EBITDA margin expanded by 3.58 percentage points to 9.86% from 6.28%. The company reported EBITDA CAGR of 66.7% across FY23 to FY26. The margin rose in every annual period shown, from 7.01% in FY24 to 8.13% in FY25 and 9.86% in FY26.
Net profit rose to Rs 140.2 crore in FY26 from Rs 19.8 crore in FY23, while net profit margin increased to 6.94% from 2.92%. Shanti Gold reported profit after tax, or PAT, CAGR of 91.3% for the four years. In the FY26 year-on-year comparison, PAT was Rs 140.15 crore versus Rs 54.10 crore, an increase of 159.05%, while profit before tax rose 159.34% to Rs 184.38 crore.
Finance costs declined to Rs 18.33 crore in FY26 from Rs 19.22 crore in FY25 even as EBITDA increased by Rs 109.08 crore. Other income increased to Rs 9.79 crore from Rs 6.06 crore, while depreciation rose to Rs 6.08 crore from Rs 5.66 crore. These lines helped bridge the change between operating profit and reported profit before tax.
Why were Shanti Gold’s H1FY27 margins below FY26 levels?
Shanti Gold reported EBITDA margin of 7.79% in H1FY27, below both the 9.86% FY26 margin and the 12.20% H1FY26 margin. PAT margin was 5.47% in H1FY27, compared with 6.94% in FY26 and 8.36% in H1FY26. The presentation provides the financial lines but does not state a separate reason for the margin change.
Material costs in H1FY27 were Rs 1,484.82 crore, versus Rs 754.56 crore in H1FY26, while changes in inventories were Rs (148.97) crore compared with Rs (127.89) crore. Finance costs rose to Rs 14.16 crore from Rs 9.46 crore, and tax expense increased to Rs 23.29 crore from Rs 19.31 crore. H1FY27 PAT nevertheless increased 32.52% to Rs 80.04 crore.
The quarterly comparison showed a further margin decline in Q2FY27. Q2FY27 EBITDA margin was 5.70%, against 8.55% in Q2FY26 and 9.97% in Q1FY27, while PAT margin was 3.96%, against 6.06% and 7.05%, respectively. Q2FY27 revenue still increased 73.45% year on year to Rs 745.95 crore, and EBITDA increased 15.56% to Rs 42.52 crore.
Got a follow-up? Ask IRIS
How did Shanti Gold’s debt and equity position change?
Shanti Gold’s published debt-to-equity ratio declined in each fiscal year, from 2.37x in FY23 to 2.18x in FY24, 1.77x in FY25 and 0.36x in FY26. The presentation defines debt-to-equity as total debt divided by total equity. The lower FY26 ratio coincided with revenue of Rs 2,018.7 crore and total equity of Rs 598.39 crore.
Total equity increased to Rs 598.39 crore at 31 March 2026 from Rs 137.73 crore at 31 March 2025. Other equity accounted for Rs 526.29 crore in FY26, compared with Rs 83.73 crore in FY25, while share capital rose to Rs 72.10 crore from Rs 54.00 crore. Current borrowings declined to Rs 198.33 crore from Rs 213.57 crore and non-current borrowings fell to Rs 7.28 crore from Rs 19.43 crore.
At 30 September 2026, total equity had risen to Rs 777.44 crore, while current borrowings were Rs 403.99 crore, more than the Rs 198.33 crore recorded at 31 March 2026. Inventories increased to Rs 530.97 crore from Rs 347.49 crore and trade receivables rose to Rs 535.12 crore from Rs 362.94 crore. During Q2FY27, Shanti Gold raised Rs 99.83 crore through a rights issue of 46,43,471 equity shares at Rs 215 per share.
What did Shanti Gold’s return ratios show in FY26?
Shanti Gold’s return on capital employed, or ROCE, rose to 32.06% in FY26 from 19.36% in FY23, after falling to 16.89% in FY24 and rising to 24.48% in FY25. The company defines ROCE as earnings before interest and tax divided by average total equity, debt, lease liabilities and deferred tax liabilities. The FY26 result followed the increase in EBITDA to Rs 199.0 crore.
Return on equity, or ROE, was 38.08% in FY26, compared with 28.39% in FY23 and 46.16% in FY25. Shanti Gold defines ROE as net profit divided by average net worth. The FY26 ROE decline from FY25 occurred as net profit increased to Rs 140.2 crore from Rs 54.1 crore and total equity rose to Rs 598.39 crore from Rs 137.73 crore.
Basic earnings per share in H1FY27 were Rs 10.96, down 3.86% from Rs 11.40 in H1FY26, despite PAT increasing to Rs 80.04 crore from Rs 60.40 crore. Q2FY27 basic earnings per share were Rs 3.99 compared with Rs 7.30 a year earlier. The rights issue disclosed in Q2FY27 added 46,43,471 shares at an issue price of Rs 215 each.
Conclusion
Shanti Gold’s FY23-to-FY26 record combined revenue growth from Rs 679.4 crore to Rs 2,018.7 crore with EBITDA-margin expansion from 6.28% to 9.86% and a decline in debt-to-equity from 2.37x to 0.36x. Net profit increased from Rs 19.8 crore to Rs 140.2 crore, while ROCE reached 32.06% in FY26.
The next disclosed developments to watch are the difference between FY26 margins and the H1FY27 outcome, when EBITDA margin was 7.79% and Q2FY27 margin was 5.70%. The balance sheet also showed current borrowings of Rs 403.99 crore, inventories of Rs 530.97 crore and receivables of Rs 535.12 crore at 30 September 2026, following the Rs 99.83 crore Q2FY27 rights issue.