










Sharda Motor’s FY26 returns fell as profit grew
Key highlights
- Sharda Motor reported FY26 ROE of 26%, down from 34% in FY24.
- Sharda Motor reported FY26 ROCE of 32%, down from 39% in FY24.
- Sharda Motor’s FY26 consolidated PAT rose to Rs 345 crore from Rs 149 crore in FY22.
- Sharda Motor’s H1FY27 revenue rose 44% to Rs 2,222.3 crore while EBITDA margin was 10.3%.
powered by IRIS
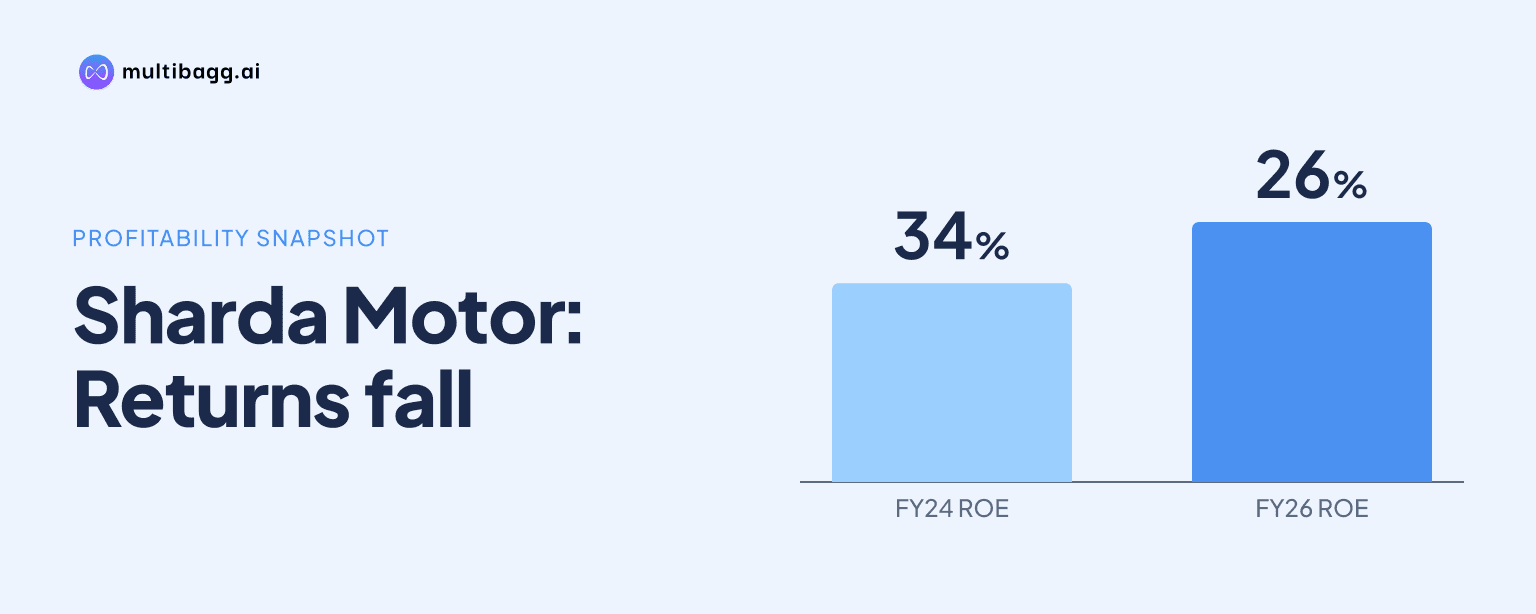
Sharda Motor reported return on equity of 26% and return on capital employed of 32% in FY26, below their FY24 peaks of 34% and 39%, respectively, even as consolidated profit after tax rose to Rs 345 crore from Rs 149 crore in FY22. The presentation therefore shows earnings growth alongside lower reported returns on capital.
Know Sharda Motor Industries inside out
Results, valuation, peers and who's buying, in one view.
What happened to Sharda Motor’s return ratios in FY26?
Sharda Motor’s return on equity, or ROE, declined to 26% in FY26 from 30% in FY25 and 34% in FY24. The FY26 figure was also below the 30% reported in FY22 and 31% in FY23, making FY24 the high point in the five-year series presented by management.
Return on capital employed, or ROCE, fell to 32% in FY26 from 38% in FY25 and 39% in FY24. FY26 ROCE was also below 37% in FY22 and 35% in FY23, showing that both return measures retreated after FY24 despite subsequent growth in reported profit.
Sharda Motor defines ROE as net profit after tax divided by total equity, while ROCE is earnings before interest and tax, or EBIT, divided by total debt plus total equity. These formulas mean that movements in equity or debt can affect the ratios independently of changes in profit after tax, or PAT, and EBIT.
The presentation does not provide annual debt, equity and EBIT inputs for FY22 through FY26 to reconcile each return percentage. It does report consolidated total equity of Rs 1,313 crore at March 2026 and Rs 1,383.7 crore at September 2026, an increase of Rs 70.7 crore during the first half of FY27.
How much did Sharda Motor grow between FY22 and FY26?
Sharda Motor’s consolidated revenue from operations increased to Rs 3,397 crore in FY26 from Rs 2,255 crore in FY22, representing the 10.8% compound annual growth rate, or CAGR, reported by management. Revenue rose in every listed year, including a Rs 560 crore increase in FY26 after a Rs 28 crore rise in FY25.
Consolidated earnings before interest, tax, depreciation and amortisation, or EBITDA, rose from Rs 228 crore in FY22 to Rs 419 crore in FY26, for a stated CAGR of 16.4%. EBITDA rose by Rs 79 crore in FY24, Rs 35 crore in FY25 and Rs 23 crore in FY26, while FY26 revenue increased by Rs 560 crore.
Sharda Motor’s PAT reached Rs 345 crore in FY26, compared with Rs 315 crore in FY25 and Rs 149 crore in FY22. Management reports a 23.4% PAT CAGR over FY22 to FY26, exceeding the stated 16.4% EBITDA CAGR and 10.8% revenue CAGR for the same period.
The largest annual PAT increase in the series was Rs 92 crore in FY24, when profit rose from Rs 208 crore to Rs 300 crore. PAT then rose by Rs 15 crore in FY25 and Rs 30 crore in FY26, while ROE decreased from 34% in FY24 to 30% and then 26%.
Got a follow-up? Ask IRIS
How did FY26 earnings change from FY25?
Sharda Motor’s FY26 consolidated revenue rose Rs 560 crore to Rs 3,397 crore, EBITDA rose Rs 23 crore to Rs 419 crore, and PAT rose Rs 30 crore to Rs 345 crore. All three measures increased from FY25 even as ROE decreased by 4 percentage points and ROCE decreased by 6 percentage points.
Using the reported figures, FY26 revenue grew about 20% from FY25, compared with about 6% growth in EBITDA and about 10% growth in PAT. The historical-financial-highlights pages do not disclose annual EBITDA or PAT margins for FY26, so they do not provide an annual margin-based explanation for the movement in return ratios.
The return-ratio decline does not indicate a decline in absolute earnings, because FY26 PAT was Rs 345 crore versus Rs 315 crore in FY25. Under Sharda Motor’s definitions, the capital bases of total equity for ROE and total debt plus total equity for ROCE are also part of the calculation.
What do Sharda Motor’s FY27 interim results show?
Sharda Motor reported H1FY27 consolidated revenue of Rs 2,222.3 crore, up 44% from Rs 1,543.5 crore in H1FY26. H1FY27 EBITDA increased 15% to Rs 229 crore and PAT increased 6% to Rs 186 crore, indicating that profit measures grew more slowly than revenue in the six-month comparison.
H1FY27 gross profit margin was 19.7%, compared with 24.9% in H1FY26, while EBITDA margin was 10.3% versus 12.9% and PAT margin was 8.4% versus 11.3%. EBIT increased 16% to Rs 246.2 crore, but EBIT margin declined to 11.1% from 13.7% in the prior-year half.
In Q2FY27, revenue was Rs 1,211.2 crore, 54% above Rs 787.2 crore in Q2FY26 and 20% above Rs 1,011.1 crore in Q1FY27. Q2FY27 PAT was Rs 99.4 crore, up 33% year on year and 15% quarter on quarter, while PAT margin was 8.2% compared with 9.5% a year earlier.
Sharda Motor’s consolidated balance sheet showed total equity of Rs 1,383.7 crore at September 2026, cash and cash equivalents of Rs 114.7 crore, and current investments of Rs 968.4 crore. Trade receivables rose to Rs 435 crore from Rs 362.3 crore at March 2026, whereas inventories were nearly unchanged at Rs 282.6 crore from Rs 282.4 crore.
Conclusion
Sharda Motor’s FY22-to-FY26 results show profit expansion alongside lower returns after the FY24 peak. Revenue increased by Rs 1,142 crore, EBITDA by Rs 191 crore and PAT by Rs 196 crore over the period, while ROE moved from 30% to 26% and ROCE from 37% to 32%.
The next disclosures to watch are subsequent revenue, margin, total-equity and debt figures, because Sharda Motor’s H1FY27 revenue grew 44% while EBITDA and PAT grew 15% and 6%, respectively. The supplied presentation gives no FY27 ROE or ROCE target, capital plan, or scheduled event.