










Sheela Foam H1 PAT reaches Rs 109 crore despite Q2 EBITDA fall
Key highlights
- Sheela Foam's H1 FY27 consolidated PAT rose to Rs 109 crore from Rs 17 crore in H1 FY26.
- Sheela Foam's H1 FY27 consolidated revenue from operations increased 22% to Rs 2,077 crore.
- Sheela Foam's Q2 FY27 consolidated reported EBITDA declined 5% to Rs 83 crore despite 19% revenue growth.
- Sheela Foam's Q2 FY27 consolidated reported EBITDA margin was 8.0%, versus 10.6% in Q1 FY27.
powered by IRIS
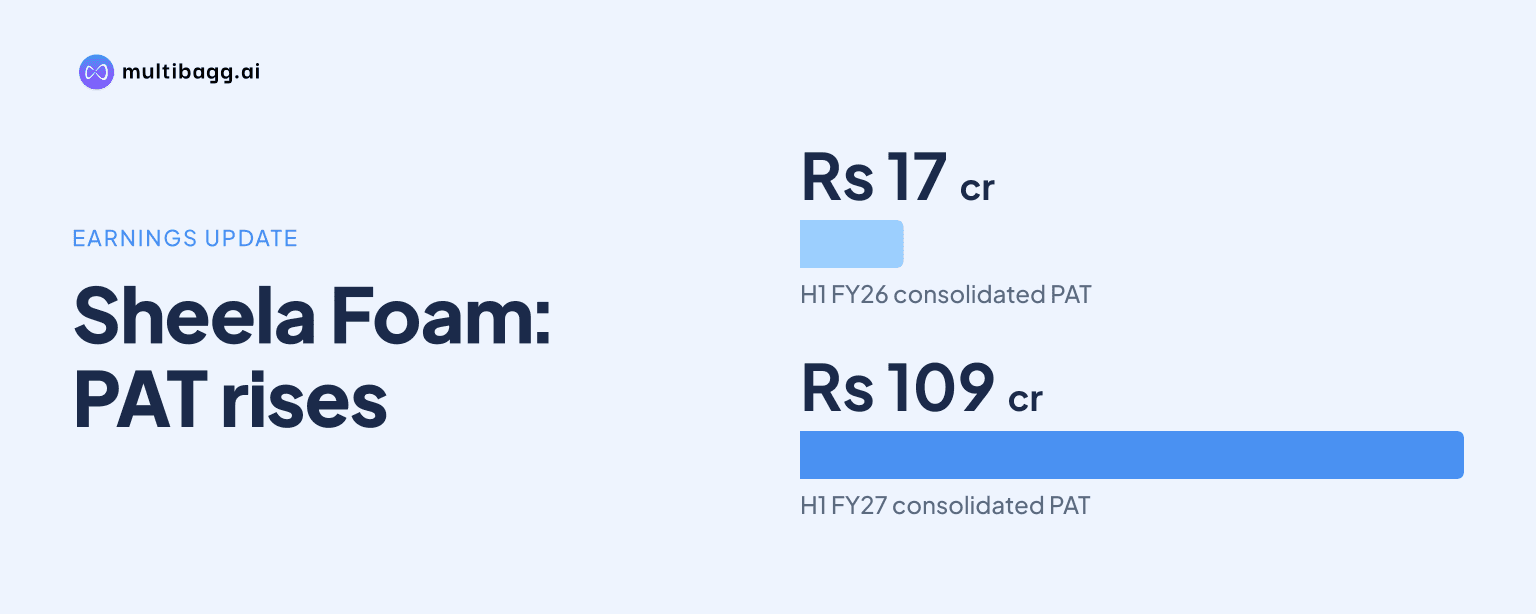
Sheela Foam reported consolidated profit after tax (PAT) of Rs 109 crore in H1 FY27, versus Rs 17 crore in H1 FY26, as profit before tax (PBT) reached Rs 127 crore from Rs 30 crore despite reported EBITDA margin declining to 9.2% from 9.6%.
Know Sheela Foam inside out
Results, valuation, peers and who's buying, in one view.
What drove Sheela Foam's H1 FY27 PAT increase?
Sheela Foam's consolidated PAT rose by Rs 92 crore year on year to Rs 109 crore in H1 FY27, while revenue from operations increased 22% to Rs 2,077 crore from Rs 1,696 crore. Reported EBITDA, or earnings before interest, tax, depreciation and amortisation, increased 18% to Rs 192 crore from Rs 162 crore, and PBT rose to Rs 127 crore from Rs 30 crore.
Operating expenses increased to Rs 1,885 crore from Rs 1,534 crore, rising alongside revenue and reducing reported EBITDA margin by 40 basis points to 9.2%. A basis point is one-hundredth of a percentage point. The figures show that absolute EBITDA grew by Rs 30 crore even as the operating margin was lower than the 9.6% recorded in H1 FY26.
Below the operating line, other income increased to Rs 38 crore from Rs 20 crore, depreciation fell to Rs 68 crore from Rs 96 crore, and finance cost declined to Rs 35 crore from Rs 57 crore. The H1 FY27 statement also reports a Rs 6 crore exceptional item, tax of Rs 32 crore versus Rs 9 crore, and Rs 8 crore as share in profit or loss of a joint venture, compared with Rs 4 crore a year earlier.
Why did Sheela Foam's Q2 FY27 EBITDA decline despite higher revenue?
Sheela Foam's consolidated reported EBITDA fell 5% year on year to Rs 83 crore in Q2 FY27 because operating expenses increased to Rs 962 crore from Rs 788 crore while revenue rose 19% to Rs 1,045 crore from Rs 875 crore. Reported EBITDA margin was 8.0%, compared with 10.0% in Q2 FY26.
The quarterly comparison with Q1 FY27 shows a further operating-margin decline. Revenue increased 1% from Rs 1,032 crore in Q1 FY27, but reported EBITDA declined 24% from Rs 109 crore and operating expenses rose from Rs 923 crore. The reported EBITDA margin consequently fell 260 basis points from 10.6% in Q1 FY27 to 8.0% in Q2 FY27.
Q2 consolidated PAT was Rs 46 crore, up from Rs 10 crore a year earlier but down from Rs 62 crore in Q1 FY27. Year on year, other income doubled to Rs 22 crore, depreciation declined to Rs 34 crore from Rs 50 crore, and finance cost fell to Rs 17 crore from Rs 28 crore; Q2 PBT nevertheless stood at Rs 53 crore, below Rs 73 crore in Q1 FY27.
How did depreciation and finance cost affect H1 FY27 profit?
Sheela Foam's H1 FY27 depreciation declined by Rs 28 crore to Rs 68 crore, while finance cost fell by Rs 22 crore to Rs 35 crore. Together, those two charges were Rs 50 crore lower than the Rs 153 crore reported in H1 FY26, alongside the Rs 97 crore increase in PBT.
Other income provided a separate Rs 18 crore year-on-year increase, reaching Rs 38 crore in H1 FY27. Share in profit or loss of the joint venture was Rs 8 crore, compared with Rs 4 crore in H1 FY26, while tax increased to Rs 32 crore from Rs 9 crore.
The difference between operating and bottom-line growth is visible in the reported margins and earnings per share. Reported EBITDA rose 18% while PAT increased from Rs 17 crore to Rs 109 crore; PAT margin expanded to 5.2% from 1.0%, diluted earnings per share rose to Rs 9.8 from Rs 1.5, and total comprehensive income was Rs 112 crore versus Rs 58 crore.
Got a follow-up? Ask IRIS
How did standalone H1 FY27 results compare with consolidated results?
Sheela Foam reported standalone H1 FY27 PAT of Rs 75 crore, compared with consolidated PAT of Rs 109 crore. Standalone revenue from operations was Rs 1,542 crore versus consolidated revenue of Rs 2,077 crore, while standalone EBITDA was Rs 129 crore and consolidated reported EBITDA was Rs 192 crore.
Standalone revenue rose 18% from Rs 1,301 crore in H1 FY26, but standalone EBITDA increased 5% from Rs 123 crore. Its EBITDA margin declined to 8.4% from 9.4%, a 100-basis-point contraction that was larger than the 40-basis-point decline in the consolidated reported EBITDA margin.
Standalone PBT increased to Rs 95 crore from Rs 32 crore, with depreciation falling to Rs 35 crore from Rs 63 crore and finance cost declining to Rs 25 crore from Rs 45 crore. Standalone PAT rose from Rs 16 crore to Rs 75 crore and its PAT margin reached 5% from 1%; the presentation does not identify the entities or transactions behind the difference between standalone and consolidated results.
What does the Q2 FY27 comparison show about profitability?
Sheela Foam's Q2 FY27 consolidated PAT of Rs 46 crore was Rs 16 crore below Q1 FY27 PAT of Rs 62 crore, following a Rs 26 crore sequential fall in reported EBITDA. Revenue was Rs 13 crore higher than Q1 FY27 at Rs 1,045 crore, but operating expenses increased by Rs 39 crore to Rs 962 crore.
Other income rose to Rs 22 crore from Rs 16 crore sequentially, depreciation was unchanged at Rs 34 crore, and finance cost fell by Rs 1 crore to Rs 17 crore. PBT declined to Rs 53 crore from Rs 73 crore, while tax decreased to Rs 12 crore from Rs 20 crore and share in joint-venture profit increased to Rs 5 crore from Rs 3 crore.
Standalone results moved in the same quarterly direction. Q2 FY27 standalone EBITDA was Rs 61 crore, compared with Rs 68 crore in Q1 FY27 and Rs 63 crore in Q2 FY26, while the margin was 7.8%, versus 9.0% and 9.4% respectively. Standalone PAT was Rs 31 crore, below Rs 44 crore in Q1 FY27 but above Rs 6 crore a year earlier.
Conclusion
Sheela Foam's H1 FY27 results show that a 22% increase in consolidated revenue and an 18% rise in reported EBITDA were accompanied by a lower EBITDA margin, while reduced depreciation and finance cost, higher other income and joint-venture profit coincided with PAT increasing to Rs 109 crore. The H1 PAT margin rose to 5.2% from 1.0%, even though reported EBITDA margin fell to 9.2% from 9.6%.
The disclosed unresolved issue is whether the Q2 FY27 consolidated reported EBITDA margin of 8.0%, down from 10.6% in Q1 FY27, changes in subsequent periods. The presentation provides no outlook, target or stated management plan for revenue, costs or margins beyond the reported H1 FY27 and Q2 FY27 income statements.