










Sula Q2 profit rises 34% despite higher blended grape costs
Key highlights
- Sula reported Q2 FY27 PAT of Rs 8.1 crore, up 34% year on year.
- Gross margin declined 278 bps to 66.2% as cost of goods sold rose 13% to Rs 45.8 crore.
- Elite & Premium revenue grew 9.0% to Rs 105.4 crore and reached 82% of Own Brand revenue.
- Wine Tourism revenue rose 24% to Rs 16.3 crore, while room revenue increased 32%.
powered by IRIS
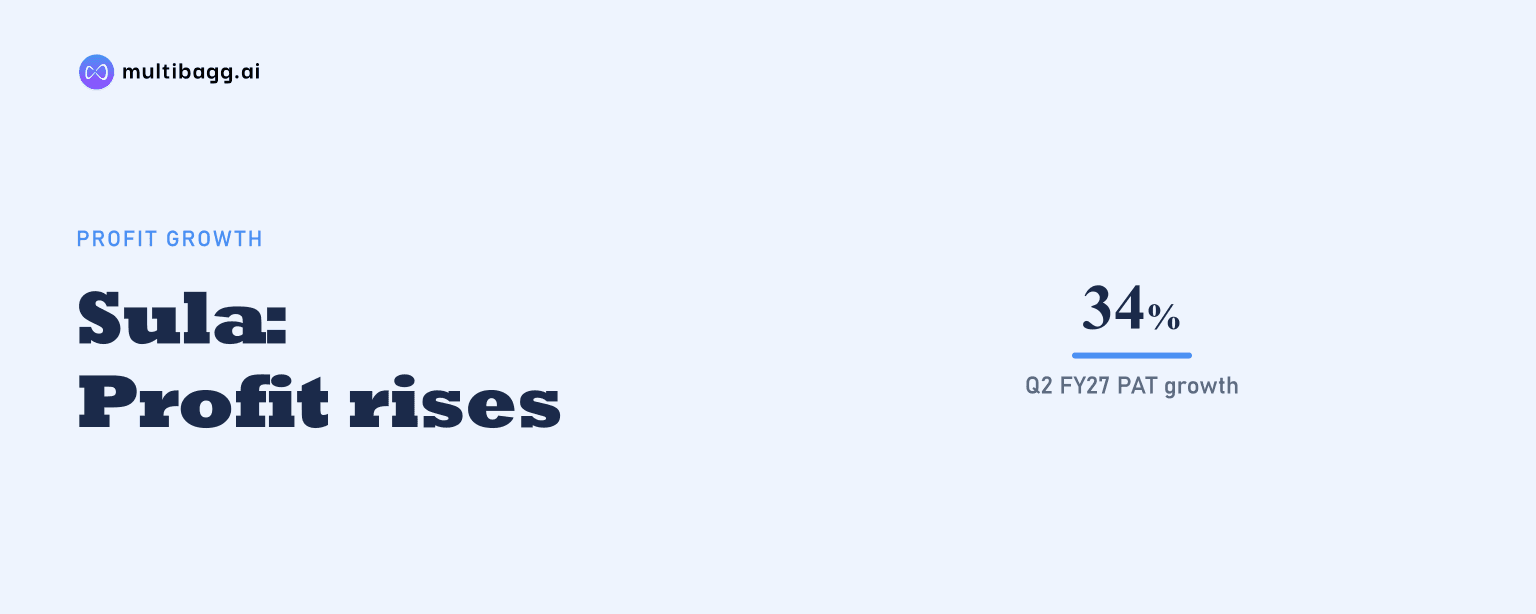
Sula Vineyards reported profit after tax of Rs 8.1 crore in Q2 FY27, up 34% year on year, despite a 278-basis-point, or bps, decline in gross margin to 66.2%. Higher premium-wine sales, lower operating costs and a Rs 1.4 crore reduction in finance costs lifted operating earnings and net profit.
Know Sula Vineyards inside out
Results, valuation, peers and who's buying, in one view.
Why did Sula's Q2 FY27 profit increase 34%?
Sula's Q2 FY27 profit increased 34% because operating earnings rose and finance costs fell, more than offsetting the decline in gross profit. Profit after tax, or PAT, rose to Rs 8.1 crore from Rs 6.0 crore in Q2 FY26, while profit before tax increased 32% to Rs 10.9 crore from Rs 8.3 crore. Operating earnings before interest, tax, depreciation and amortisation, or operating EBITDA, rose 7.9% to Rs 27.5 crore.
The increase in operating EBITDA came even as gross profit slipped 0.6% to Rs 89.7 crore from Rs 90.3 crore. Employee cost declined 6% to Rs 21.8 crore, compared with Rs 23.2 crore a year earlier, and other expenses decreased 3% to Rs 40.5 crore. Other income rose to Rs 1.0 crore from Rs 0.8 crore, while finance costs fell 16% to Rs 7.2 crore from Rs 8.6 crore.
Sula's operating EBITDA margin increased by 85 bps to 20.3% of net revenue in Q2 FY27, from 19.4% in Q2 FY26. PAT margin, calculated by the company on net revenue plus other income, increased 136 bps to 5.9% from 4.6%. Tax rose 26% to Rs 2.8 crore, but the increase was smaller than the Rs 2.6 crore rise in profit before tax.
How did grape costs affect Sula's Q2 FY27 margins?
Higher blended grape costs reduced Sula's Q2 FY27 gross margin to 66.2%, from 69.0% in Q2 FY26. Cost of goods sold rose 13% to Rs 45.8 crore, while net revenue from operations grew 4% to Rs 135.5 crore. As a result, gross profit decreased by Rs 0.6 crore even though sales expanded.
The gross-margin pressure was more pronounced than the change in EBITDA margin because cost actions and sales mix supported expenses below gross profit. Sula said healthy growth in its premium portfolio and strategic cost actions helped operating EBITDA rise by about 8% to Rs 27.5 crore. The 278-bps gross-margin decline therefore occurred alongside an 85-bps improvement in operating EBITDA margin.
Management attributed the H1 FY27 gross-margin impact primarily to higher blended grape cost and described it as temporary. Management expects the impact to subside from Q4 FY27 and gross margin to normalise from Q1 FY28, as the wine and table-grape mix rebalances in Harvest 2027. This is management's stated expectation rather than a reported outcome for Q2 FY27.
Got a follow-up? Ask IRIS
Which Sula businesses drove Q2 FY27 revenue?
Own Brands and Wine Tourism drove Sula's Q2 FY27 revenue growth, while the Others segment declined. Own Brand revenue rose 3% to Rs 128.3 crore from Rs 124.1 crore, and Wine Tourism revenue increased 24% to Rs 16.3 crore from Rs 13.2 crore. Others, including BIO, fell 66% to Rs 0.8 crore from Rs 2.4 crore, taking revenue from operations to Rs 145.4 crore, up 4%.
The premiumisation mix shifted further toward Elite & Premium wines. Elite & Premium revenue increased 9.0% to Rs 105.4 crore in Q2 FY27, while Economy & Popular revenue declined 16.4% to Rs 23.0 crore. Elite & Premium represented 82% of Own Brand revenue, up 420 bps from 78% in Q2 FY26, whereas Economy & Popular declined to 18% from 22%.
Wine Tourism's 24% revenue growth was primarily supported by room revenue, which grew 32% year on year. The business recorded more than 97,800 visitors, up 7%, and day-visitor spend per guest rose 4% to Rs 1,765. Average room rate, or ARR, increased 3% to Rs 10,014, while occupancy was 66%, compared with 76% a year earlier after a 50% increase in rooms; excluding The Haven, occupancy was 73%.
What is Sula's outlook for grape costs and expansion?
Management expects grape-cost pressure to start easing in Q4 FY27 and to normalise from Q1 FY28, subject to the Harvest 2027 wine and table-grape mix rebalancing it anticipates. In the nearer term, management said it is focused on building on H1 FY27 momentum and closing FY27 on a strong note. Q2 FY27 net revenue was Rs 135.5 crore and operating EBITDA was Rs 27.5 crore, providing the reported base for that objective.
Sula also plans to launch wine-based ready-to-drink, or RTD, products in Q3 FY27. The company has opened The Vintage Room, a 5,000-square-foot indoor banquet facility at its Nashik campus with capacity for 300 people, and said it had already hosted its first event. These initiatives follow Wine Tourism's rise to 19.1% of total revenue including wine sales, up 220 bps year on year.
The company said it will soon begin construction of its fourth hotel, a 35-key property beside The Haven and near its flagship Nashik campus. Sula expects that hotel to open in Q4 FY28. The existing Wine Tourism estate includes three luxury vineyard resorts with 154 keys, while The Haven was launched in October 2026 and contributed to the higher room inventory affecting Q2 FY27 occupancy.
Conclusion
Sula's Q2 FY27 results show that a 34% rise in PAT to Rs 8.1 crore was achieved despite higher grape costs reducing gross margin by 278 bps. Growth in Elite & Premium wine revenue of 9%, Wine Tourism revenue growth of 24%, lower employee and other expenses, and a 16% reduction in finance costs together lifted operating EBITDA margin by 85 bps.
The next disclosed milestones are the planned Q3 FY27 launch of wine-based RTDs, management's expectation that grape-cost pressure will ease from Q4 FY27 and normalise in Q1 FY28, and the proposed 35-key fourth hotel, expected to open in Q4 FY28. The Harvest 2027 mix rebalance is the stated factor underlying management's margin-normalisation outlook.