










Synergy Green H1 loss reaches Rs 15.19 crore amid input costs
Key highlights
- H1 FY27 total income rose 20.2% to Rs 192.02 crore, from Rs 159.76 crore in H1 FY26.
- H1 FY27 loss after tax was Rs 15.19 crore, compared with a Rs 5.74 crore profit a year earlier.
- H1 FY27 PBDIT margin fell to 8.9% from 15.6% in H1 FY26.
- Inventories increased to Rs 97.90 crore and trade payables rose to Rs 101.91 crore at 30 September 2026.
powered by IRIS
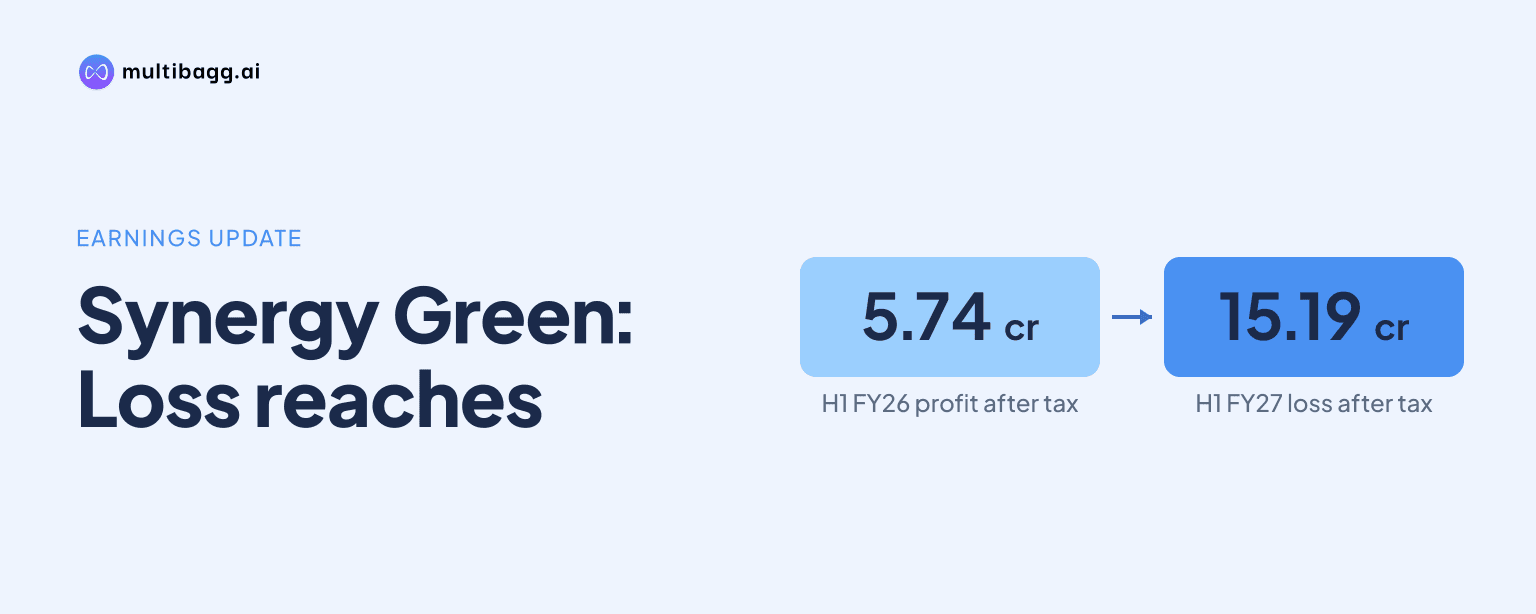
Synergy Green Industries Limited reported a Rs 15.19 crore net loss in H1 FY27, versus a Rs 5.74 crore profit in H1 FY26, although total income rose 20.2% to Rs 192.02 crore. The company attributed the decline to steep input-cost escalation, which reduced its PBDIT margin to 8.9% from 15.6% a year earlier.
Know Synergy Green Industries inside out
Results, valuation, peers and who's buying, in one view.
Why did Synergy Green report a loss despite higher H1 revenue?
Synergy Green reported a loss because its operating profit declined while depreciation and finance costs increased. Profit before depreciation, interest and tax, or PBDIT, fell 31.1% to Rs 17.13 crore in H1 FY27 from Rs 24.86 crore in H1 FY26, even as total income increased by Rs 32.26 crore. Management said H1 FY27 margins were primarily affected by steep input-cost escalation.
The margin movement shows the gap between revenue growth and operating profitability. PBDIT margin was 8.9% in H1 FY27, down 6.7 percentage points from 15.6% in H1 FY26. In the second quarter, the margin was 10.2%, higher than 7.0% in Q1 FY27 but below 15.7% in Q2 FY26. Thus, the sequential quarter improved, but it did not return to the margin recorded a year earlier.
Depreciation and amortization increased by Rs 11.74 crore year on year to Rs 18.78 crore in H1 FY27, while finance costs rose Rs 4.98 crore to Rs 14.33 crore. These two charges exceeded PBDIT, resulting in a Rs 15.98 crore loss before tax and exceptional items. The tax and deferred-tax line was negative Rs 0.79 crore, compared with tax expense of Rs 2.74 crore a year earlier, leaving a Rs 15.19 crore net loss.
How did Synergy Green’s revenue and production change in H1 FY27?
Synergy Green increased H1 FY27 total income by 20.2% year on year to Rs 192.02 crore, while production rose 25.8%, according to management. Q2 FY27 generated Rs 116.31 crore of income, compared with Rs 75.71 crore in Q1 FY27 and Rs 74.37 crore in Q2 FY26. The second quarter therefore accounted for a larger share of the half-year income than the first quarter.
The revenue mix changed materially between the two half years. Wind domestic revenue rose to Rs 54 crore in H1 FY27 from Rs 12 crore in H1 FY26, while wind export revenue increased to Rs 34 crore from Rs 27 crore. Direct export declined to Rs 36 crore from Rs 45 crore, gear box revenue declined to Rs 41 crore from Rs 45 crore, and non-wind revenue fell to Rs 27 crore from Rs 30 crore.
Capacity utilisation was 75% actual in H1 FY26-27, compared with 93% for FY25-26 and 88% for FY24-25. The company projects 80% utilisation for FY26-27. Its capacity stood at 45,000 metric tonnes per annum in FY25-26, while the presentation lists an 80% projected utilisation rate for FY26-27.
Got a follow-up? Ask IRIS
What changed in Synergy Green’s balance sheet by September 2026?
Synergy Green’s inventory and trade payables both increased by 30 September 2026 relative to 31 March 2026. Inventories rose by Rs 35.18 crore to Rs 97.90 crore, while trade payables increased by Rs 31.01 crore to Rs 101.91 crore. Total assets and equity and liabilities each increased to Rs 485.76 crore from Rs 473.25 crore.
Net worth declined to Rs 95.10 crore at 30 September 2026 from Rs 111.48 crore at 31 March 2026, a movement consistent with the Rs 15.19 crore H1 loss. Long-term borrowings rose to Rs 176.21 crore from Rs 163.21 crore, whereas short-term borrowings declined to Rs 81.99 crore from Rs 87.19 crore. The source does not specify the individual reasons for the inventory or payable changes.
Trade receivables declined by Rs 17.13 crore to Rs 47.84 crore over the same period, while cash and bank balances decreased by Rs 1.61 crore to Rs 10.35 crore. Non-current assets reduced to Rs 293.91 crore from Rs 299.76 crore. Other current assets increased to Rs 35.76 crore from Rs 33.83 crore, and other current liabilities fell to Rs 22.64 crore from Rs 31.62 crore.
What is Synergy Green management forecasting for FY27?
Synergy Green management projects about 33% revenue growth in FY27 over FY26, supported by additional capacity and new customers. Its FY26 revenue was Rs 376 crore, while the FY26-27 projected revenue figure is Rs 500 crore, based on executable order-book projections and schedules available to management when the presentation was published.
Management also projects export revenue growth of about 50% over FY26, with exports contributing around 30% of total FY27 revenue. It expects PBDIT margin to expand by around 100 basis points year on year, considering the current input-price scenario. These are management projections, and the company says order-book projections may change with market conditions.
The longer-term capacity plan lists 75,000 metric tonnes per annum in FY28-29 and 100,000 metric tonnes per annum in FY29-30, up from 45,000 metric tonnes per annum in FY25-26. The company also identifies an opportunity for one more greenfield expansion during the next three to four years that could take capacity above 100,000 metric tonnes. Its SWOT analysis says 80% of business comes from the wind industry and notes that volatile commodity prices can affect profitability, although key commodities are hedged with customers quarterly.
Conclusion
Synergy Green’s H1 FY27 results show that a Rs 32.26 crore year-on-year increase in income and 25.8% production growth did not offset input-cost pressure, lower PBDIT and higher depreciation and finance costs. The result was a shift from a Rs 5.74 crore H1 FY26 profit to a Rs 15.19 crore loss, alongside higher inventories and trade payables.
The next disclosed measures to watch are management’s Rs 500 crore FY27 revenue projection, its expected 100-basis-point year-on-year PBDIT-margin expansion, and its 80% FY26-27 utilisation projection. The presentation also sets out capacity targets of 75,000 metric tonnes per annum by FY28-29 and 100,000 metric tonnes per annum by FY29-30.