Actions
Action Type





IRIS
Multibagg AI is an AI powered stock research and analysis platform. We provide data, information, content, and analytics for publicly traded Indian companies listed on NSE and BSE. AI can make mistakes, check important information.
Prices might be delayed by a few minutes.
Join our Exclusive Community


Join our Exclusive Community
Made with 💙 in India. © Finsky Technologies Pvt Ltd. 2026


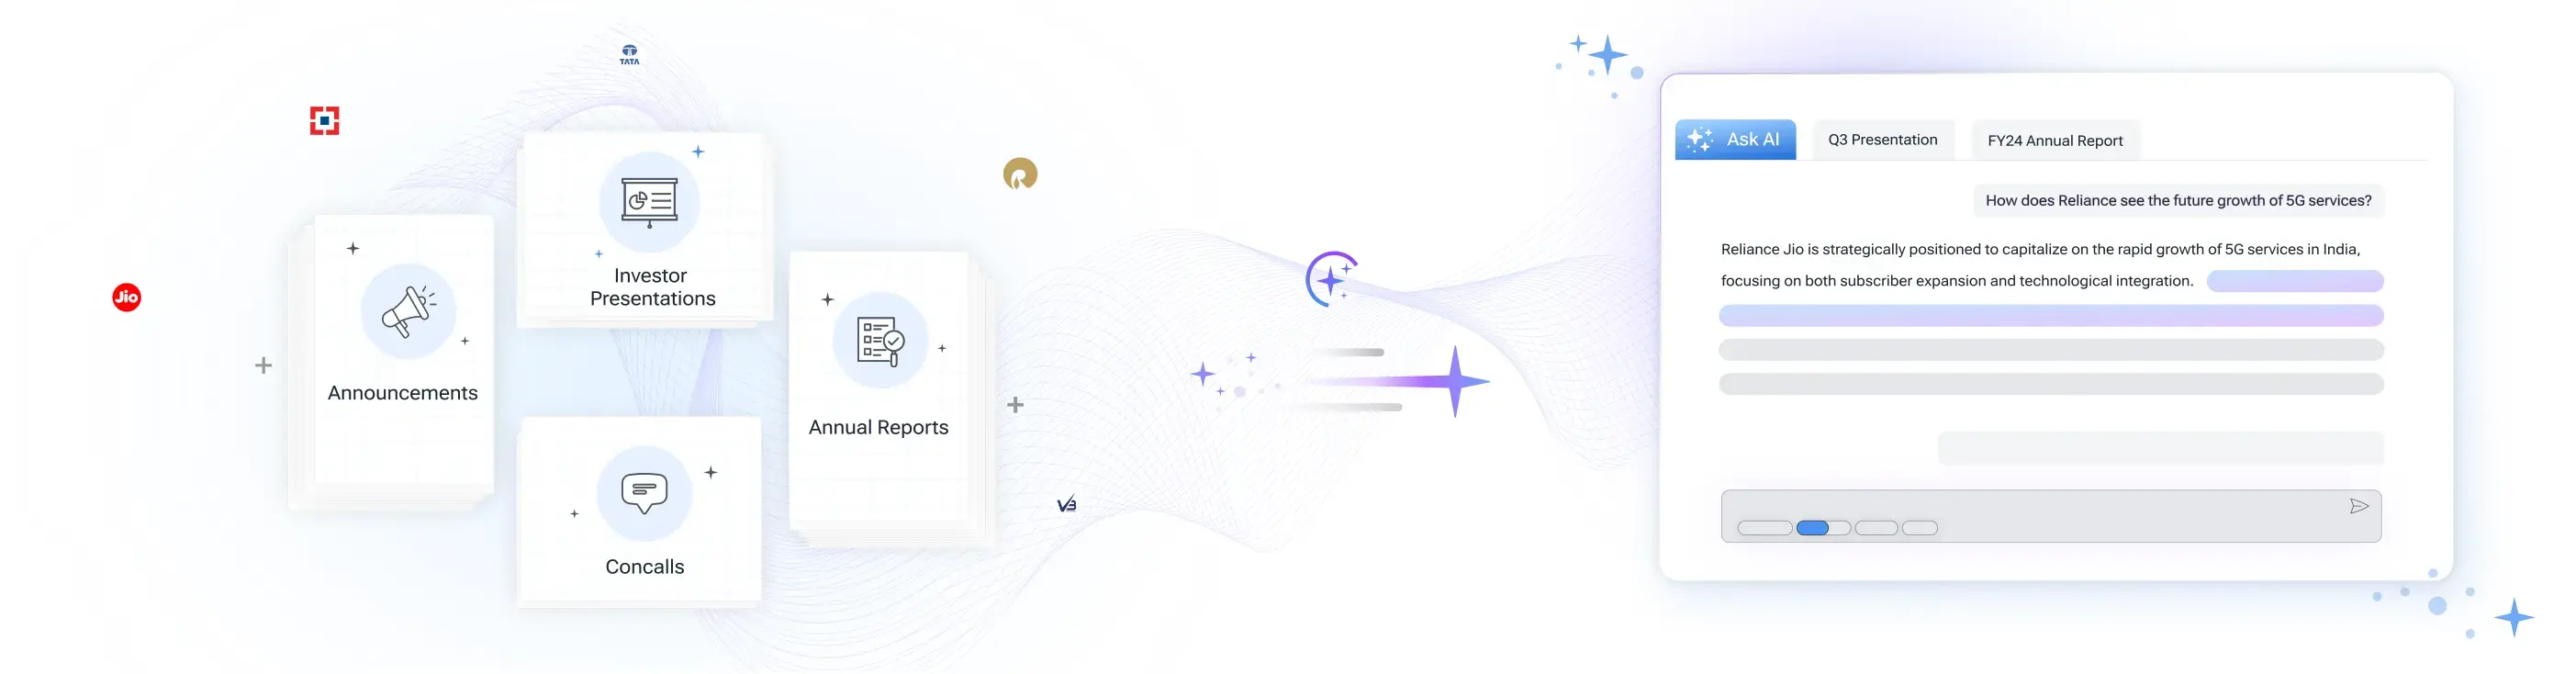
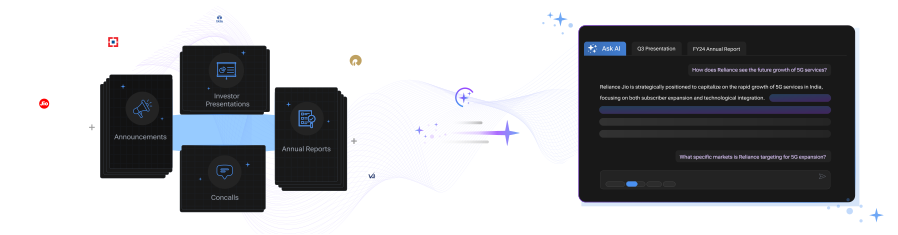
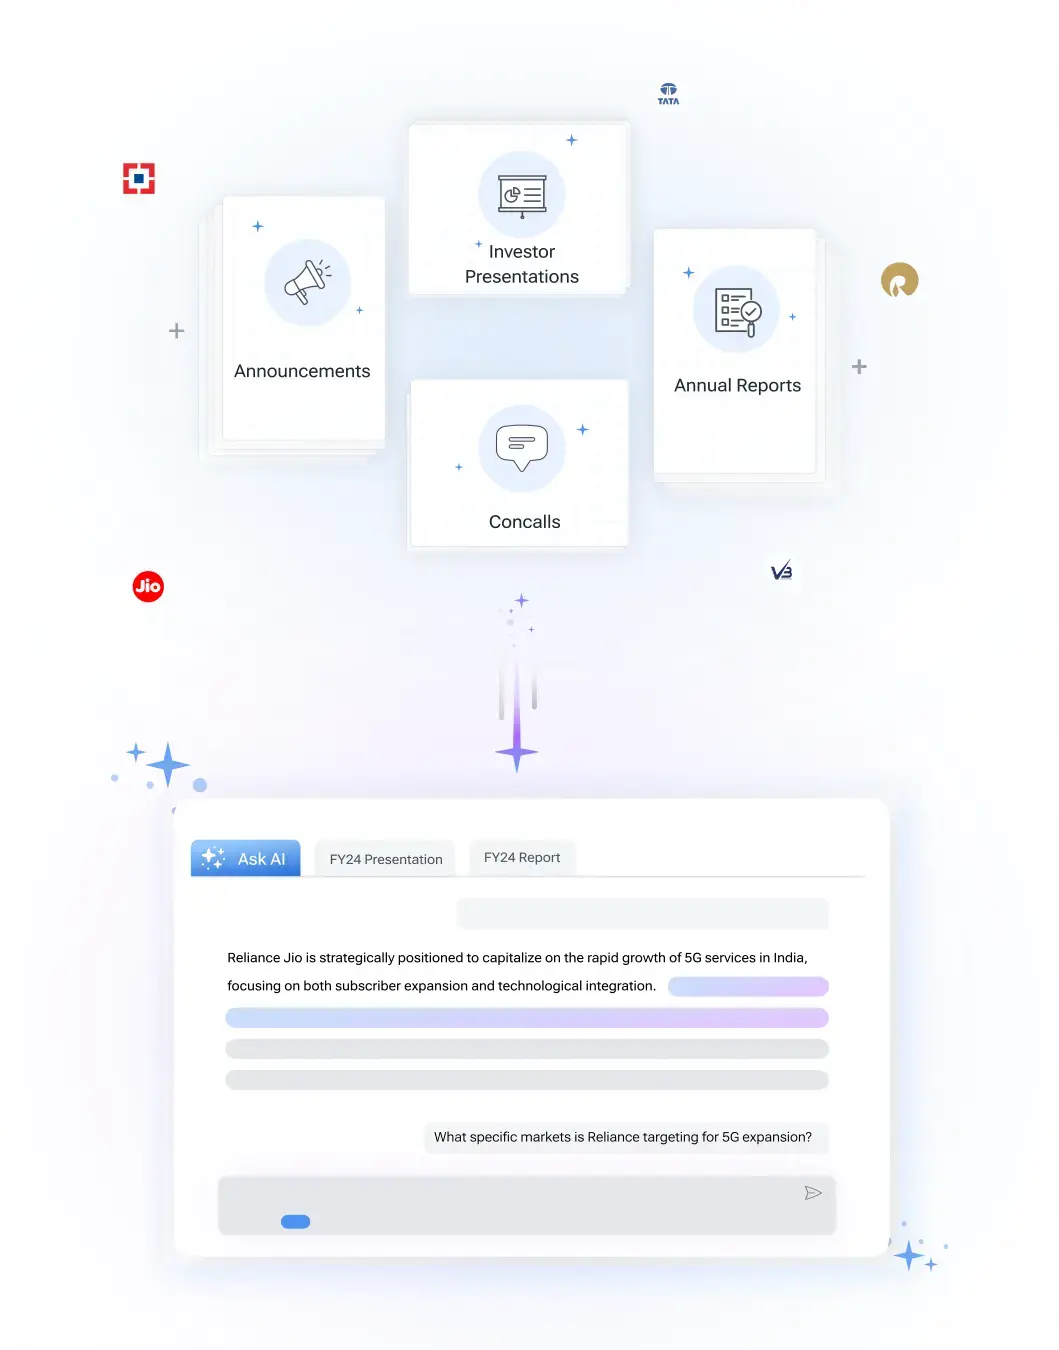
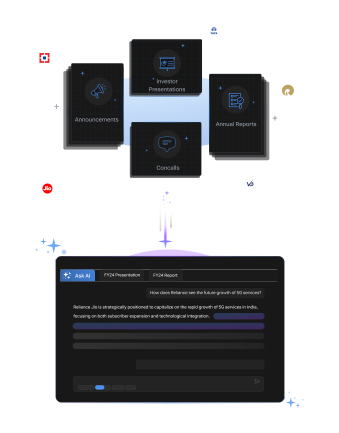
Get instant AI-powered insights about company performance, financials, and strategy. Ask questions about trends, competition, and developments while receiving responses backed by official documents and market data, with clear attribution to source documents.

 Discovery themes featuring this stock

| Symbol | Watchlist | Price | Market Cap | P/E | P/B | Div Yield (%) | ROE (%) | ROCE (%) | ROA (%) |
1357.40 | 1,357 Cr | 78.24 | 12.07 | 0.04 | 15.43 | 16.46 | 7.05 | ||
147.95 | 1,287 Cr | 24.51 | 2.10 | 0.47 | 8.58 | 11.74 | 4.41 | ||
553.00 | 860 Cr | -52.83 | 9.04 | 0.18 | -17.11 | 2.51 | -3.35 | ||
75.18 | 713 Cr | 26.89 | 3.92 | 0.47 | 18.52 | 22.84 | 0.00 | ||
167.80 | 651 Cr | 25.55 | 4.75 | 0.00 | 16.33 | 20.66 | 15.11 | ||
1431.65 | 606 Cr | 36.83 | 3.96 | 0.35 | 10.75 | 14.25 | 7.68 | ||
867.25 | 316 Cr | 25.46 | 3.13 | 0.46 | 12.31 | 11.47 | 4.61 | ||
| Median: 7 Co. | — | 553.00 | 713 Cr | 25.55 | 3.96 | 0.35 | 12.31 | 14.25 | 4.61 |
View Standalone
View Standalone
View Standalone
View Standalone
View Standalone
View Standalone
View Standalone
View Standalone
Bearish
3
Neutral
7
Bullish
4
Bearish
35
Neutral
7
Bullish
4
Bearish
32
Neutral
0
Bullish
0
Bearish
32
Neutral
0
Bullish
0
Bearish
32
Neutral
0
Bullish
0
Bearish
32
Neutral
0
Bullish
0
Synergy Green Industries Ltd (SGIL) is currently trading at 543.55 per share. Stock prices fluctuate during market hours on NSE and BSE based on demand, company updates, and overall market conditions. Refer to the live price chart above for the most recent price movement.
Synergy Green Industries Limited manufactures large SG Iron, grey iron and steel castings for wind turbines, wind gearboxes and general engineering applications, primarily serving 3–30 metric-tonne requirements from facilities in Kolhapur, Maharashtra. It operates 45,000 tonnes of annual foundry capacity and 20,000 tonnes of machining and surface-treatment capacity. Demand is materially ahead of available capacity, with management indicating customer requirements exceeding 60,000 tonnes against 45,000 tonnes installed. Nordex alone has provided confirmed export orders above ₹200 crore, while Vestas is pressing for uninterrupted capacity allocation, making execution and skilled manpower—not demand— the principal near-term constraint. First-half revenue increased 20.2% to ₹192 crore and production rose 25.8%, but logistics disruptions prevented some finished castings from being shipped and created inventory buildup. Consequently, first-half PBDIT margin fell to 8.9% from 15.6%, despite management expecting second-half margins near 17–18% as pricing corrections flow through. The US has become a particularly attractive growth market because wind OEMs are diversifying away from China and tariff differences favor Indian suppliers. AI-driven data-center electricity demand is reinforcing renewable-energy installations, while Synergy Green Industries Limited expects exports to grow more than 50% and reach approximately 30% of FY2027 revenue. Management is deliberately prioritizing execution over rapid debt-funded expansion. The company intends to stabilize its recently expanded facilities, train skilled personnel and improve machining utilization before committing to a greenfield project, reflecting a disciplined approach despite strong demand and a potentially extended wind-energy investment cycle.
Over the past 52 weeks, Synergy Green Industries Ltd has traded between a low of ₹422.05 and a high of ₹695.00. The 52-week high and low indicate the stock’s price range over the last year and help investors understand its volatility and recent trading levels.
Synergy Green Industries Ltd has a market capitalization of approximately 859.53. Market capitalization represents the total value of a company’s outstanding shares and helps investors understand its size, stability, and relative risk compared to other listed companies.
Synergy Green Industries Ltd’s investment profile depends on its business fundamentals, valuation, and long-term outlook. The stock currently trades at a PE ratio of -52.83 and operates in the its sector sector. Investors typically assess financial performance, growth prospects, and individual risk tolerance before making investment decisions.
Based on its market capitalization of 859.53 Cr, Synergy Green Industries Ltd is classified as a Small Cap stock. Large-cap stocks are generally more stable, while mid-cap and small-cap stocks tend to offer higher growth potential along with higher price volatility.
Synergy Green Industries Ltd operates in the its sector sector. Sector classification matters because companies in the same sector are often affected by similar economic conditions, regulatory changes, and competitive dynamics, which can influence overall stock performance.
The Price-to-Earnings (PE) ratio of Synergy Green Industries Ltd is -52.83. The PE ratio compares a company’s share price to its earnings and is commonly used to assess valuation. Comparing the PE ratio with sector peers and historical levels provides better context.
Synergy said it has a confirmed Nordex export order book of more than Rs 200 crore. Management said the orders are for US exports over the coming 12 months and described the Nordex book as fully booked.
Synergy Green has retained a management target of Rs 500 crore turnover for FY27. Management said the target represents 33% growth over FY26 and expects more than Rs 300 crore of revenue in H2.
Synergy says its immediate priority is to stabilise the expansion from 30,000 tonnes to 45,000 tonnes completed last March. Management also cited the need to train specialised workers and avoid excessive debt or equity dilution while funding a new project.
Synergy Green identifies 80% of its business as coming from the wind industry in its SWOT analysis. Its product presentation also assigns 70% to wind castings and 15% to gearbox castings, although the company does not reconcile those measures.



Synergy Green Industries Limited manufactures large SG Iron, grey iron and steel castings for wind turbines, wind gearboxes and general engineering applications, primarily serving 3–30 metric-tonne requirements from facilities in Kolhapur, Maharashtra. It operates 45,000 tonnes of annual foundry capacity and 20,000 tonnes of machining and surface-treatment capacity.
Demand is materially ahead of available capacity, with management indicating customer requirements exceeding 60,000 tonnes against 45,000 tonnes installed. Nordex alone has provided confirmed export orders above ₹200 crore, while Vestas is pressing for uninterrupted capacity allocation, making execution and skilled manpower—not demand— the principal near-term constraint.
First-half revenue increased 20.2% to ₹192 crore and production rose 25.8%, but logistics disruptions prevented some finished castings from being shipped and created inventory buildup. Consequently, first-half PBDIT margin fell to 8.9% from 15.6%, despite management expecting second-half margins near 17–18% as pricing corrections flow through.
The US has become a particularly attractive growth market because wind OEMs are diversifying away from China and tariff differences favor Indian suppliers. AI-driven data-center electricity demand is reinforcing renewable-energy installations, while Synergy Green Industries Limited expects exports to grow more than 50% and reach approximately 30% of FY2027 revenue.
Management is deliberately prioritizing execution over rapid debt-funded expansion. The company intends to stabilize its recently expanded facilities, train skilled personnel and improve machining utilization before committing to a greenfield project, reflecting a disciplined approach despite strong demand and a potentially extended wind-energy investment cycle.
Industrial Products
Castings & Forgings
843 Cr
Low Risk
-51.8
31.1
—
9.0
695.00
422.05
Sales CAGR
Profit CAGR
ROE
ROCE