










Synergy Green H1 loss hits Rs 15.19 crore as margins fall
Key highlights
- Synergy Green reported a Rs 15.19 crore loss after tax in H1 FY27, against a Rs 5.74 crore profit in H1 FY26.
- H1 FY27 total income rose 20.2% to Rs 192.02 crore, while PBDIT margin fell to 8.9% from 15.6%.
- Inventories rose to Rs 97.90 crore and trade payables increased to Rs 101.91 crore at September 30, 2026.
- Management projects FY27 revenue of Rs 500 crore and PBDIT-margin expansion of around 100 basis points year on year.
powered by IRIS
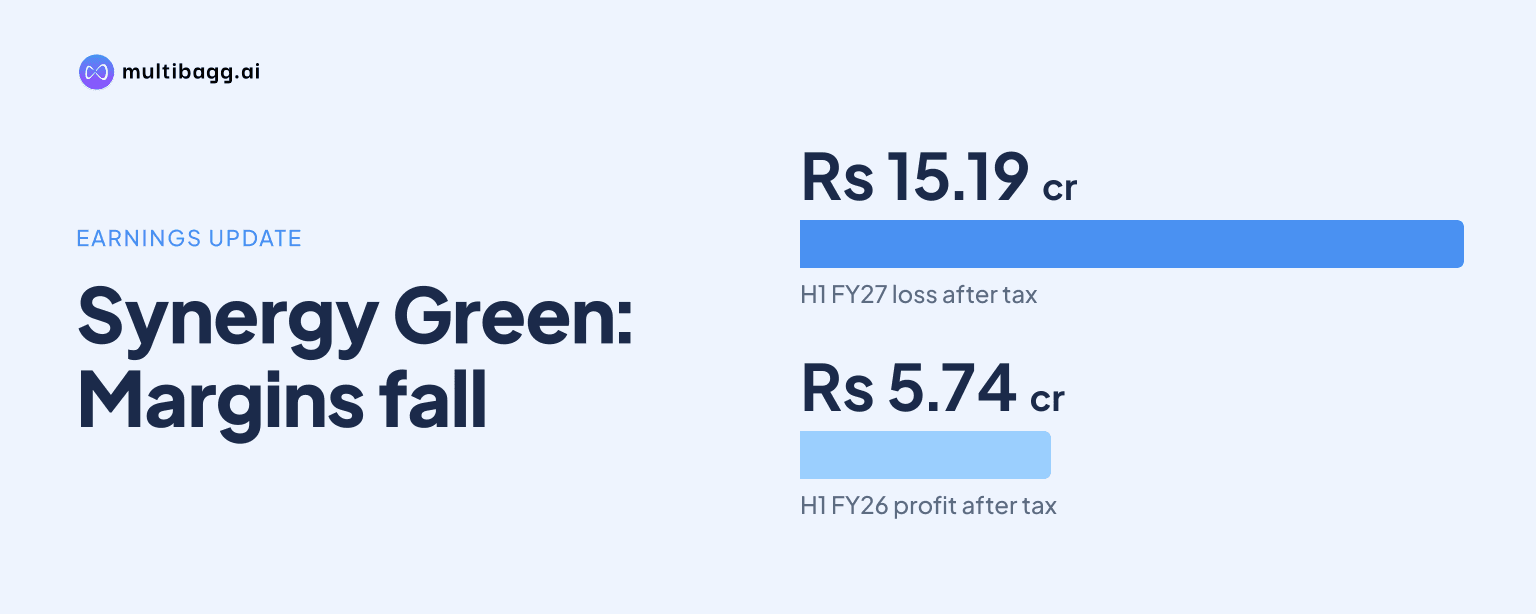
Synergy Green Industries Ltd reported a Rs 15.19 crore loss after tax in H1 FY27, against a Rs 5.74 crore profit a year earlier, despite total income rising 20.2% to Rs 192.02 crore. Synergy Green said steep input-cost escalation primarily reduced margins, while depreciation and finance costs also increased.
Know Synergy Green Industries inside out
Results, valuation, peers and who's buying, in one view.
Why did Synergy Green report a loss despite higher H1 revenue?
Synergy Green reported a loss because operating profit declined even as H1 FY27 total income increased to Rs 192.02 crore from Rs 159.76 crore in H1 FY26. Profit before depreciation, interest and tax, or PBDIT, fell to Rs 17.13 crore from Rs 24.86 crore. Its PBDIT margin contracted to 8.9% from 15.6%.
Management attributed the FY27 margin effect primarily to steep input-cost escalation. Production nevertheless increased 25.8% year on year in H1 FY27, indicating that the higher output did not prevent the margin contraction. PBDIT measures earnings before depreciation, finance costs and tax.
The move to a H1 loss also reflected higher non-operating charges. Depreciation and amortisation increased to Rs 18.78 crore from Rs 7.04 crore, while finance costs rose to Rs 14.33 crore from Rs 9.35 crore. Profit before tax before exceptional items consequently changed from a Rs 8.47 crore profit to a Rs 15.98 crore loss.
How did Synergy Green’s Q2 FY27 compare with Q1 and last year?
Synergy Green’s Q2 FY27 result improved from Q1 FY27 but remained below Q2 FY26 on margin and profitability. Total income reached Rs 116.31 crore in the quarter ended September 30, 2026, compared with Rs 75.71 crore in the June 2026 quarter. PBDIT increased to Rs 11.84 crore from Rs 5.30 crore, while the loss after tax narrowed to Rs 5.08 crore from Rs 10.11 crore.
Against the quarter ended September 30, 2025, Q2 FY27 total income rose from Rs 74.37 crore to Rs 116.31 crore. However, the PBDIT margin was 10.2%, compared with 15.7% a year earlier, and the result after tax changed from a Rs 2.36 crore profit to a Rs 5.08 crore loss. The presentation identifies the quarterly results as unaudited.
Q2’s sequential improvement did not offset the first-quarter loss. Although Q2 PBDIT of Rs 11.84 crore was above the Rs 5.30 crore recorded in Q1, depreciation of Rs 9.97 crore and finance costs of Rs 7.15 crore together exceeded Q2 PBDIT. Profit before tax before exceptional items was therefore a Rs 5.29 crore loss in Q2.
Got a follow-up? Ask IRIS
What changed in Synergy Green’s balance sheet since March 2026?
Synergy Green’s inventories, trade payables and long-term borrowings increased between March 31, 2026 and September 30, 2026, while net worth and trade receivables declined. Inventories rose by Rs 35.18 crore to Rs 97.90 crore, trade payables increased by Rs 31.01 crore to Rs 101.91 crore, and long-term borrowings rose by Rs 13.00 crore to Rs 176.21 crore.
Net worth decreased to Rs 95.10 crore from Rs 111.48 crore, a Rs 16.38 crore reduction during a half year that included a Rs 15.19 crore loss after tax. Short-term borrowings declined to Rs 81.99 crore from Rs 87.19 crore, partly offsetting the rise in long-term debt. Total assets and total equity and liabilities both increased to Rs 485.76 crore from Rs 473.25 crore.
Trade receivables fell by Rs 17.13 crore to Rs 47.84 crore, while cash and bank balances decreased by Rs 1.61 crore to Rs 10.35 crore. Non-current assets declined to Rs 293.91 crore from Rs 299.76 crore, whereas other current assets increased to Rs 35.76 crore from Rs 33.83 crore. These balance-sheet movements occurred as H1 FY27 total income reached Rs 192.02 crore.
What is Synergy Green projecting for FY27 and capacity?
Synergy Green projects FY27 revenue of Rs 500 crore, about 33% above FY26 revenue of Rs 376.37 crore, based on its executable order-book projection. Management said additional capacity and new customer orders support the projection. H1 FY27 total income of Rs 192.02 crore equals 38.4% of that FY27 projection.
Management also projects export revenue growth of about 50% over FY26, with exports contributing around 30% of FY27 revenue. It expects PBDIT margin to expand by around 100 basis points year on year, where one basis point equals one-hundredth of a percentage point. That outlook follows the 8.9% H1 FY27 PBDIT margin and management’s stated input-price pressure.
Capacity utilisation was 75% actual in H1 FY26-27, compared with 93% in FY25-26, and Synergy Green projects 80% for full-year FY26-27. Capacity was 45,000 metric tonnes per annum in FY25-26, with plans for 75,000 metric tonnes per annum by FY28-29 and 100,000 metric tonnes per annum by FY29-30. The presentation also cites an opportunity for a further greenfield expansion over the next three to four years to exceed 100,000 metric tonnes per annum.
Conclusion
Synergy Green’s H1 FY27 results show that 20.2% growth in total income and 25.8% growth in production did not translate into earnings. The PBDIT margin fell by 6.7 percentage points to 8.9%, while higher depreciation and finance costs contributed to a Rs 15.19 crore loss after tax. Inventory, trade payables and long-term borrowings also rose from March 2026.
The next reported measures will be management’s Rs 500 crore FY27 revenue projection, its expectation of around 100 basis points of PBDIT-margin expansion and its projected 80% capacity utilisation for FY26-27. Management’s planned increase from 45,000 metric tonnes per annum in FY25-26 to 75,000 metric tonnes per annum by FY28-29 is also a disclosed capacity milestone to monitor.