










Tamboli Industries current borrowings reach Rs 5.70 crore
Key highlights
- Tamboli Industries' consolidated current borrowings rose to Rs 5.70 crore at September 30, 2026, from Rs 58.68 lakh at March 31.
- Tamboli Industries' combined current and non-current borrowings were Rs 7.26 crore at September 30, 2026, versus Rs 2.43 crore at March 31.
- Tamboli Industries' consolidated inventories increased by Rs 4.12 crore to Rs 17.74 crore during the six months to September 30, 2026.
- Tamboli Industries reported consolidated half-year profit after tax of Rs 5.51 crore, compared with Rs 3.21 crore a year earlier.
powered by IRIS
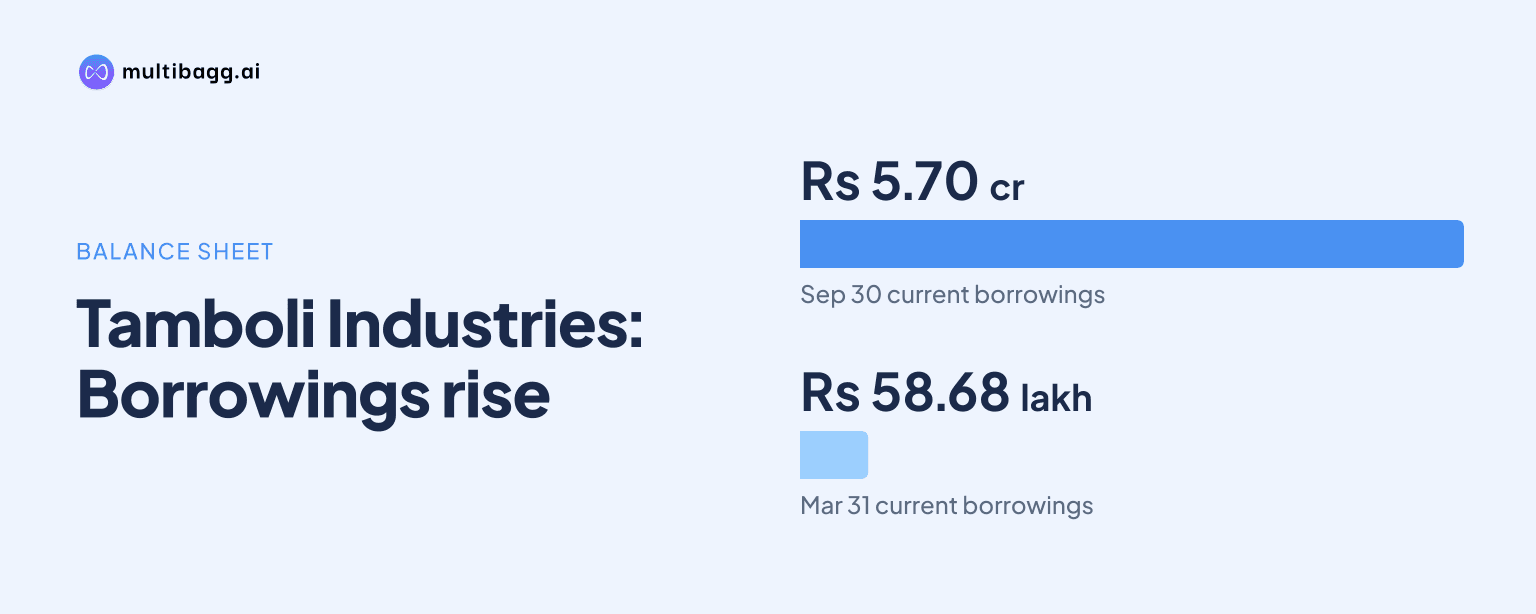
Tamboli Industries Limited reported consolidated current borrowings of Rs 5.70 crore at September 30, 2026, up from Rs 58.68 lakh at March 31, while inventories rose to Rs 17.74 crore and cash and cash equivalents fell to Rs 80.23 lakh. The unaudited balance sheet shows a marked shift toward short-term funding.
Know Tamboli Industries inside out
Results, valuation, peers and who's buying, in one view.
Why did Tamboli Industries' current borrowings rise?
Tamboli Industries' consolidated current borrowings rose by Rs 5.11 crore over the six months to September 30, 2026, reaching Rs 5.70 crore from Rs 58.68 lakh at March 31, 2026. The statement of assets and liabilities does not identify the lender, borrowing instrument, interest rate, purpose or repayment schedule for the current-borrowings balance.
The increase coincided with higher inventories. Consolidated inventories rose by Rs 4.12 crore to Rs 17.74 crore at September 30 from Rs 13.61 crore at the March 31 financial year-end, and the consolidated cash-flow statement also records a Rs 4.12 crore increase in inventories during the half year. Tamboli Industries does not explicitly state that the additional current borrowings funded the inventory movement.
Cash and cash equivalents moved in the opposite direction, declining by Rs 1.06 crore to Rs 80.23 lakh at September 30 from Rs 1.86 crore at March 31. That decline and the inventory increase occurred in the same six-month period as the borrowing increase, but the filing provides no direct allocation between the borrowings and individual current-asset accounts.
How did Tamboli Industries' overall borrowing mix change?
Tamboli Industries' combined current and non-current borrowings increased to Rs 7.26 crore at September 30, 2026, from Rs 2.43 crore at March 31, 2026. The increase was concentrated in current borrowings, which represented the larger part of the Rs 7.26 crore closing balance at September-end.
Non-current borrowings declined to Rs 1.56 crore at September 30 from Rs 1.84 crore at March 31, a reduction of Rs 27.88 lakh. That reduction was substantially smaller than the Rs 5.11 crore increase in current borrowings, so the reported change was not fully offset by a lower non-current borrowing balance.
Finance cost was Rs 20.53 lakh for the six months ended September 30, 2026, compared with Rs 24.82 lakh for the corresponding six months of 2025. Finance cost is a half-year income-statement measure, whereas the Rs 7.26 crore borrowing figure is a balance at September 30, so the two figures do not establish the cost of the closing debt position alone.
Other reported liabilities changed less sharply than borrowings. Other current financial liabilities were Rs 1.44 crore at September 30, compared with Rs 1.40 crore at March 31, while trade payables to micro and small enterprises declined to Rs 1.47 crore from Rs 1.55 crore. Dues to creditors other than micro and small enterprises increased to Rs 3.42 crore from Rs 3.31 crore.
Got a follow-up? Ask IRIS
What changed in Tamboli Industries' working-capital accounts?
Tamboli Industries' working-capital accounts showed divergent movements at September 30, 2026: inventories increased to Rs 17.74 crore, trade receivables fell to Rs 21.32 crore, and bank balances other than cash equivalents rose to Rs 20.62 crore. The filing reports these balance-sheet classifications separately and does not provide a transaction-level explanation for each change.
Trade receivables declined by Rs 84.35 lakh from Rs 22.16 crore at March 31, while bank balances other than cash equivalents increased by Rs 2.81 crore from Rs 17.82 crore. The rise in other bank balances means the Rs 1.06 crore decline in cash and cash equivalents does not describe every bank-related balance reported by Tamboli Industries.
Other current financial assets increased to Rs 3.03 crore at September 30 from Rs 65.40 lakh at March 31. Over the same period, current tax assets fell to Rs 52.12 lakh from Rs 1.42 crore, while other current assets declined to Rs 1.38 crore from Rs 1.49 crore. These classifications contributed to changes in the consolidated asset base alongside the higher inventory balance.
Total consolidated assets rose to Rs 143.24 crore at September 30 from Rs 134.69 crore at March 31, an increase of Rs 8.55 crore. Equity attributable to equity holders of the parent rose to Rs 126.79 crore from Rs 122.45 crore, while other equity increased to Rs 116.87 crore from Rs 112.53 crore.
How did Tamboli Industries' earnings and segments perform?
Tamboli Industries reported consolidated profit after tax of Rs 5.51 crore for the six months ended September 30, 2026, compared with Rs 3.21 crore in the corresponding six months of 2025. Net sales or income from operations rose to Rs 41.95 crore from Rs 35.90 crore, and profit before tax increased to Rs 7.55 crore from Rs 4.55 crore.
For the quarter ended September 30, 2026, net sales or income from operations were Rs 23.53 crore, compared with Rs 18.43 crore in the quarter ended June 30, 2026 and Rs 19.18 crore in the quarter ended September 30, 2025. Quarterly profit after tax was Rs 3.41 crore, against Rs 2.09 crore in the preceding quarter and Rs 1.94 crore a year earlier.
Manufacturing activities generated segment revenue of Rs 40.91 crore during the September 2026 half year, compared with Rs 2.76 crore from investment activities, before inter-segment revenue. Manufacturing segment assets were Rs 97.56 crore at September 30, up from Rs 95.88 crore at March 31, while investment segment assets increased to Rs 45.68 crore from Rs 38.81 crore.
Manufacturing segment liabilities were Rs 16.34 crore at September 30, compared with Rs 12.13 crore at March 31. Investment segment liabilities were Rs 11.79 lakh, compared with Rs 10.97 lakh, indicating that the increase in reported segment liabilities was concentrated in the manufacturing activity rather than the investment activity.
Conclusion
Tamboli Industries' September 30, 2026 balance sheet shows that its principal debt change was a rise in current borrowings to Rs 5.70 crore, while non-current borrowings declined to Rs 1.56 crore. The funding shift appeared alongside a Rs 4.12 crore increase in inventories, a Rs 1.06 crore decline in cash and cash equivalents, and half-year profit after tax of Rs 5.51 crore.
The next reported results will show whether current borrowings remain near the September-end balance or change alongside inventory and cash levels. Tamboli Industries has not disclosed a borrowing repayment plan, lender details, or a target for the Rs 17.74 crore inventory balance in the November 5, 2026 filing.