










TCI Express reports Rs 52 crore negative H1 free cash flow
Key highlights
- TCI Express recorded negative Rs 52 crore free cash flow in H1 FY27 after Rs 80 crore of capex.
- TCI Express generated Rs 28 crore of operating cash flow in H1 FY27, versus Rs 104 crore in FY26.
- TCI Express liquid assets declined to Rs 92.7 crore at September 2026 from Rs 136.4 crore at March 2026.
- TCI Express H1 FY27 total income rose 8.7% to Rs 654.6 crore and profit after tax rose 6.1% to Rs 49 crore.
powered by IRIS
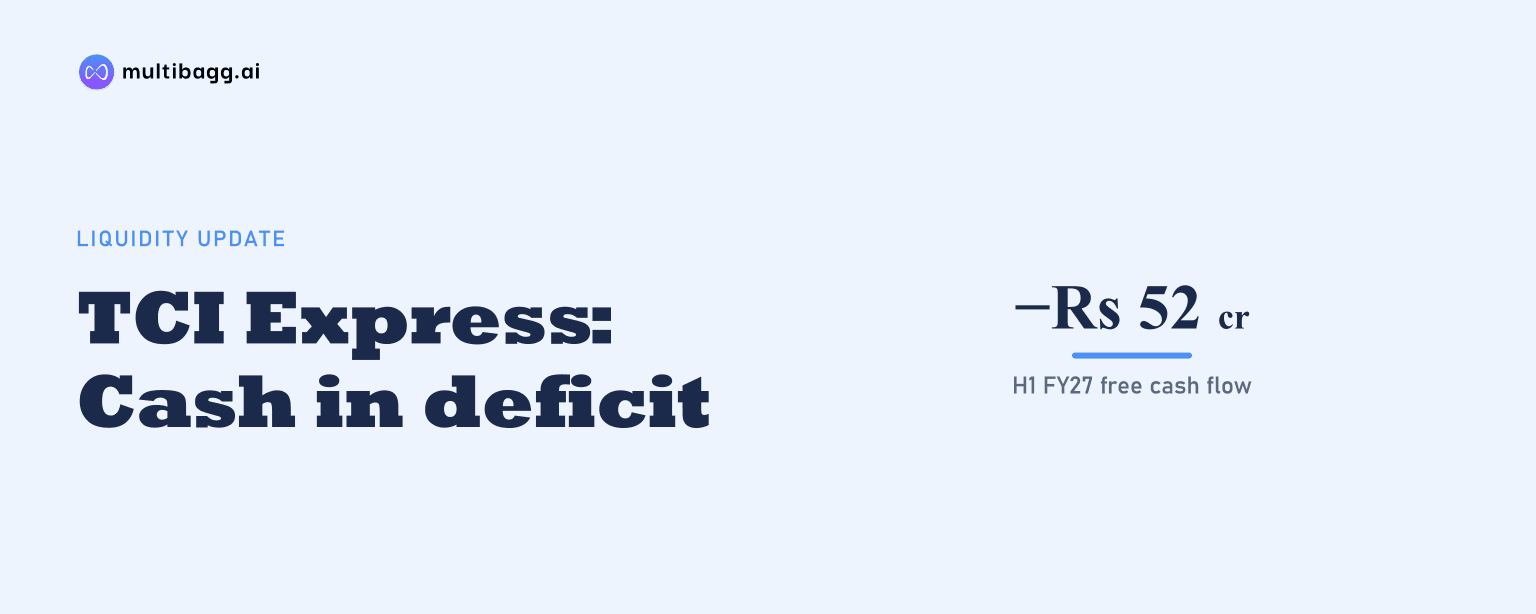
TCI Express recorded negative Rs 52 crore free cash flow in H1 FY27 after Rs 80 crore of capital expenditure for branches, sorting centres and IT infrastructure exceeded Rs 28 crore of cash flow from operations. The supplied presentation does not disclose a five-year capex target or a cut to Rs 400 crore.
Know TCI Express inside out
Results, valuation, peers and who's buying, in one view.
Why was TCI Express free cash flow negative in H1 FY27?
TCI Express reported negative Rs 52 crore free cash flow because its Rs 80 crore H1 FY27 capital expenditure was Rs 52 crore higher than Rs 28 crore of cash flow from operations. This compared with positive free cash flow of Rs 24 crore in FY26, Rs 96 crore in FY25 and Rs 84 crore in FY24.
Cash flow from operations had also declined over the reported annual periods, falling from Rs 136 crore in FY24 to Rs 118 crore in FY25 and Rs 104 crore in FY26. The H1 FY27 figure of Rs 28 crore is a half-year measure, so it is not directly comparable with full-year totals, but the presentation shows that investment exceeded operating cash generation during the period.
Where did TCI Express spend Rs 80 crore of capex?
TCI Express spent Rs 80 crore of capital expenditure in H1 FY27 on branch-network expansion, construction of sorting centres and IT infrastructure. The presentation does not allocate the Rs 80 crore between those three categories or disclose how many branches and sorting centres were added in the half year.
The H1 FY27 programme followed a longer expansion in which locations serviced increased from 32,000 in FY2017 to 60,000 in Q2 FY27. Branch offices rose from 500 to more than 1,000 and sorting centres rose from 26 to 28 over the same period, while customer count increased from 1.6 lakh to 2.25 lakh.
How did H1 FY27 spending affect TCI Express liquidity?
TCI Express reported liquid assets of Rs 92.7 crore at September 2026, down from Rs 136.4 crore at March 2026 and Rs 160.2 crore at March 2025. Total debt was Rs 15.2 crore at September 2026, compared with nil at both March 2025 and March 2026, and was entirely short-term debt.
Net debt or cash was negative Rs 77.4 crore at September 2026, compared with negative Rs 136.4 crore at March 2026, reflecting a smaller net-cash position under the presentation’s measure. Long-term debt remained nil at all three dates, while total equity increased from Rs 828.8 crore in March 2026 to Rs 878.5 crore in September 2026.
The current ratio fell to 2.59 times in H1 FY27 from 3.34 times in H1 FY26 and 3.06 times in FY26. TCI Express also reported an A1+ short-term credit rating from ICRA and an AA- long-term rating from CRISIL, but the presentation does not state whether the Rs 15.2 crore of short-term debt funded capital expenditure.
Got a follow-up? Ask IRIS
What changed in TCI Express working capital and cash conversion?
TCI Express reported net working-capital days of 27 in both Q1 FY27 and Q2 FY27, compared with 20 days in Q2 FY26. Receivables days fell by one day to 59, while payables days fell by eight days to 32, resulting in higher net working-capital days than the prior-year quarter.
The cash conversion ratio rose to 35.1% in H1 FY27 from 30.5% in H1 FY26, but was below 76.5% in FY26, 83.0% in FY25 and 70.0% in FY24. The presentation does not define the cash conversion ratio, although it states that receivables days use revenue from operations inclusive of goods and services tax.
Return on capital employed, or ROCE, was 22.0% in H1 FY27, compared with 20.0% in H1 FY26 and 19.9% in FY26. TCI Express calculates ROCE using core assets and excludes other income from earnings before interest and tax, or EBIT, for this measure.
Did TCI Express grow earnings while increasing capex?
TCI Express reported H1 FY27 total income of Rs 654.6 crore, up 8.7% year on year from Rs 602.2 crore. Earnings before interest, tax, depreciation and amortisation, or EBITDA, increased 10.8% to Rs 80 crore, and EBITDA margin increased to 12.2% from 12.0%; the presentation notes that EBITDA includes other income.
Profit after tax rose 6.1% to Rs 49 crore in H1 FY27 from Rs 46.2 crore, although its margin declined to 7.5% from 7.7%. Profit before tax increased 5.9% to Rs 64.7 crore, while its margin fell to 9.9% from 10.1%, showing that reported earnings increased even as free cash flow turned negative.
In Q2 FY27, total income was Rs 339.3 crore, up 8.8% from Rs 312 crore in Q2 FY26 and 7.6% from Rs 315.3 crore in Q1 FY27. Q2 FY27 EBITDA was Rs 43 crore at a 12.7% margin, and profit after tax was Rs 26.7 crore at a 7.9% margin; no quarterly capex or free-cash-flow figure is disclosed.
Did TCI Express cut a five-year capex target to Rs 400 crore?
No, the supplied TCI Express presentation does not disclose a five-year capital-expenditure target, an earlier target or a revised Rs 400 crore target. Its specific capital-allocation disclosure is Rs 80 crore of H1 FY27 expenditure for branch expansion, sorting-centre construction and IT infrastructure.
TCI Express does disclose a network record of more than 1,000 branch offices and 28 sorting centres by Q2 FY27. Those historical operating figures do not establish a future spending commitment, so the presentation cannot substantiate a claim that a multi-year capex plan was reduced to Rs 400 crore.
Conclusion
TCI Express combined 8.7% H1 FY27 total-income growth to Rs 654.6 crore with Rs 80 crore of spending on network and IT capacity. That capital expenditure exceeded Rs 28 crore of operating cash flow, producing negative Rs 52 crore free cash flow, while liquid assets declined to Rs 92.7 crore at September 2026.
The next issue to watch is whether operating cash flow and the 35.1% H1 FY27 cash conversion ratio change as the disclosed branch, sorting-centre and IT investment is deployed. TCI Express has not disclosed a five-year capex plan in this presentation, leaving the scale and timing of future spending unresolved.