










Golkunda Q2 FY27 profit more than doubles as EBITDA margin reaches 11.36%
Key highlights
- Golkunda reported Q2 FY27 revenue from operations of Rs 87.3547 crore, up 7.92% year on year.
- Golkunda’s Q2 FY27 EBITDA rose 84.62% to Rs 9.9428 crore and the reported EBITDA margin was 11.36%.
- Golkunda’s Q2 FY27 profit after tax rose 113.23% to Rs 6.7834 crore, with diluted earnings per share of Rs 8.23.
- Golkunda reported negative H1 FY27 operating cash flow of Rs 5.3609 crore and trade receivables of Rs 112.8336 crore.
powered by IRIS
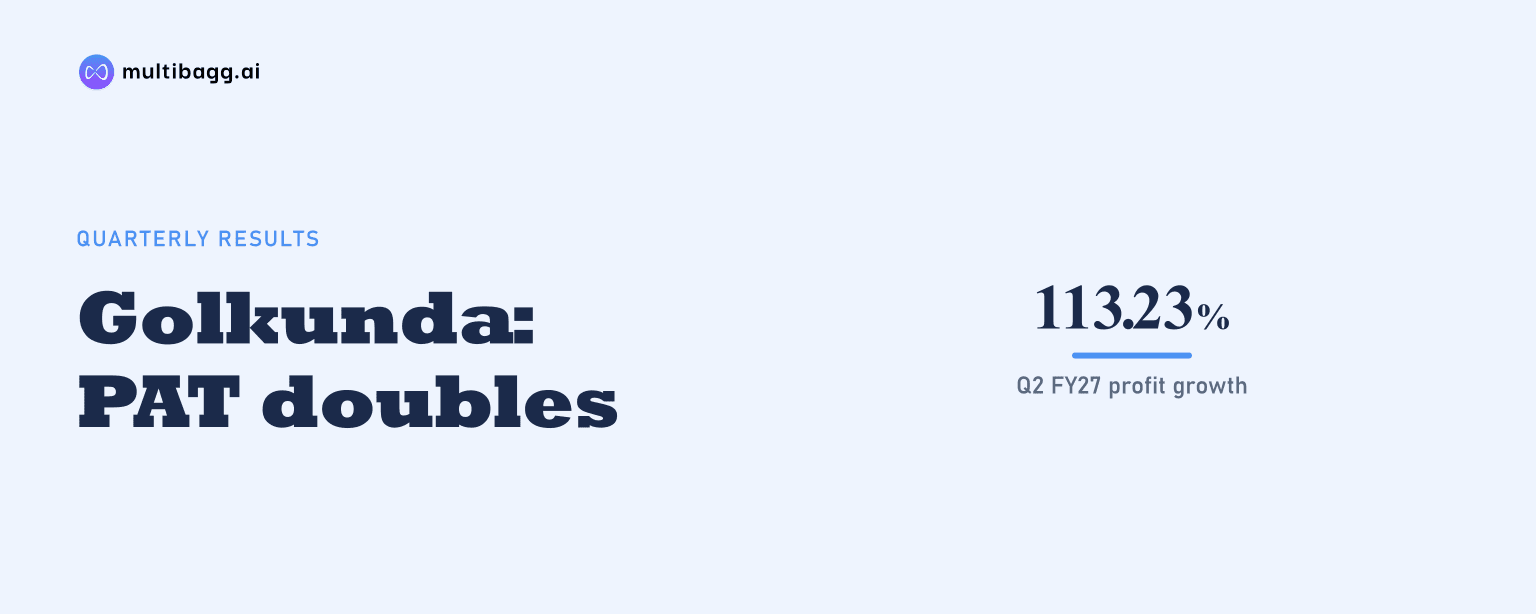
Golkunda Diamonds & Jewellery Ltd. reported Q2 FY27 profit after tax of Rs 6.7834 crore, up 113.23% year on year, while earnings before interest, tax, depreciation and amortisation (EBITDA) rose 84.62% to Rs 9.9428 crore and its EBITDA margin reached 11.36% on revenue growth of 7.92%.
Know Golkunda Diamonds & Jewellery inside out
Results, valuation, peers and who's buying, in one view.
How did Golkunda’s Q2 FY27 earnings change?
Golkunda’s Q2 FY27 profit after tax more than doubled to Rs 6.7834 crore from Rs 3.1813 crore in Q2 FY26, while revenue from operations increased to Rs 87.3547 crore from Rs 80.944 crore. The 113.23% profit increase was therefore substantially higher than the 7.92% rise in revenue. Diluted earnings per share increased 80.25% to Rs 8.23 from Rs 4.57.
Golkunda reported total revenue of Rs 87.5522 crore in Q2 FY27, including other income of Rs 19.75 lakh, compared with total revenue of Rs 81.1248 crore and other income of Rs 18.08 lakh a year earlier. Profit before tax increased to Rs 9.0534 crore from Rs 4.2761 crore, while current tax rose to Rs 2.27 crore from Rs 1.07 crore.
What changed in Golkunda’s Q2 FY27 margins and costs?
Golkunda’s reported EBITDA margin reached 11.36% in Q2 FY27, compared with 6.64% in Q2 FY26, an arithmetic increase of 472 basis points. The presentation’s income-statement table, however, labels the year-on-year EBITDA-margin change as 802 basis points, which does not correspond with the two stated margin percentages. A basis point is one-hundredth of a percentage point.
The profit after tax margin rose to 7.75% from 3.92%, a 383-basis-point change that matches the presentation’s stated comparison. Total expenditure was Rs 77.6094 crore in Q2 FY27, compared with Rs 75.7394 crore in Q2 FY26, while EBITDA increased by Rs 4.5574 crore. This difference between expenditure and EBITDA growth accompanied the reported margin expansion.
The income statement recorded a Rs 2.807 crore decrease in stock in trade in Q2 FY27, against a Rs 2.169 crore increase in Q2 FY26. Raw-material consumption rose to Rs 75.0092 crore from Rs 69.0327 crore, employee cost increased to Rs 2.7066 crore from Rs 2.5108 crore, and other expenditure increased to Rs 2.7005 crore from Rs 2.0268 crore.
Finance cost fell to Rs 46.34 lakh in Q2 FY27 from Rs 82.05 lakh a year earlier, while depreciation increased to Rs 42.60 lakh from Rs 28.88 lakh. The presentation reports these movements but gives no management commentary that assigns the quarterly margin change to a particular product, geography or operating action.
What does Golkunda’s H1 FY27 performance show?
Golkunda’s H1 FY27 revenue from operations increased 14.75% to Rs 172.5696 crore, while profit after tax rose 88.76% to Rs 11.9238 crore. EBITDA increased 77.18% to Rs 18.584 crore from Rs 10.4888 crore in H1 FY26, and the EBITDA margin rose to 10.74% from 6.96%, a stated increase of 378 basis points.
The H1 FY27 revenue-growth rate of 14.75% was higher than Q2 FY27’s 7.92% rate, while H1 diluted earnings per share rose 72.87% to Rs 15.68 from Rs 9.07. Finance cost, in contrast to the lower Q2 cost, increased to Rs 1.9188 crore in H1 FY27 from Rs 1.4482 crore in H1 FY26. The H1 profit-after-tax margin was 6.89%, compared with 4.19% a year earlier.
Golkunda’s completed-year figures show revenue from operations rose to Rs 281.5015 crore in FY26 from Rs 252.4442 crore in FY25 and Rs 230.4726 crore in FY24. FY26 EBITDA was Rs 22.8429 crore, compared with Rs 20.48 crore in FY25, but the EBITDA margin was unchanged at 8.11% in both years. Net profit margin increased from 4.17% in FY24 to 4.68% in FY25 and 4.86% in FY26.
Got a follow-up? Ask IRIS
How did Golkunda’s working capital and cash flow change?
Golkunda reported trade receivables of Rs 112.8336 crore at H1 FY27, up from Rs 87.1301 crore at FY26, while inventories declined to Rs 24.6794 crore from Rs 28.6171 crore. The receivables increase of Rs 25.7035 crore exceeded the Rs 3.9377 crore inventory reduction. Total current assets increased to Rs 159.2094 crore from Rs 138.8436 crore.
Net cash flow from operating activities was negative Rs 5.3609 crore in H1 FY27, compared with positive Rs 9.6132 crore in FY26 and positive Rs 8.473 crore in FY25. The presentation does not provide a cash-flow reconciliation or management explanation linking the operating-cash-flow result to the receivables movement, but both figures are reported for H1 FY27.
Golkunda recorded negative investing cash flow of Rs 3.2809 crore and positive financing cash flow of Rs 8.0324 crore in H1 FY27. These movements resulted in a Rs 60.95 lakh decrease in cash and cash equivalents, which ended the period at Rs 2.5886 crore, compared with Rs 3.1981 crore at the beginning of the period.
What changed in Golkunda’s borrowings and equity?
Golkunda’s total borrowings were Rs 39.2063 crore at H1 FY27, up from Rs 34.8764 crore at FY26. Current borrowings increased to Rs 33.9852 crore from Rs 27.6608 crore, while non-current borrowings declined to Rs 5.2211 crore from Rs 7.2156 crore. The change therefore came from higher current borrowings despite lower non-current borrowings.
Shareholders’ equity increased to Rs 95.0692 crore at H1 FY27 from Rs 80.2383 crore at FY26, including other equity of Rs 88.1051 crore compared with Rs 73.2742 crore. Trade payables declined to Rs 30.218 crore from Rs 31.7706 crore, while total current liabilities increased to Rs 70.0496 crore from Rs 62.8791 crore.
Conclusion
Golkunda’s Q2 FY27 figures show profit growth outpacing revenue growth, with EBITDA up 84.62%, profit after tax up 113.23% and the reported EBITDA margin at 11.36%. The H1 result also shows higher revenue and profit, but it coincided with negative operating cash flow of Rs 5.3609 crore and trade receivables of Rs 112.8336 crore.
The next reporting period will show whether Golkunda sustains the Q2 EBITDA margin and converts reported H1 earnings into operating cash flow. The presentation gives no earnings or cash-flow target, leaving investors to track disclosed receivables, inventory, current borrowings of Rs 33.9852 crore and the cash balance of Rs 2.5886 crore.