










Technocrats revenue rose 21.7 times as margins narrowed
Key highlights
- Technocrats’ revenue rose from Rs 6.062 crore in FY24 to Rs 131.309 crore in FY26.
- H1 FY27 revenue increased 97.4% year on year to Rs 103.551 crore.
- H1 FY27 EBITDA margin was 16.5%, compared with 20.0% in FY26.
- Annualised H1 FY27 ROE was 23.1% and RoCE was 28.9%.
powered by IRIS
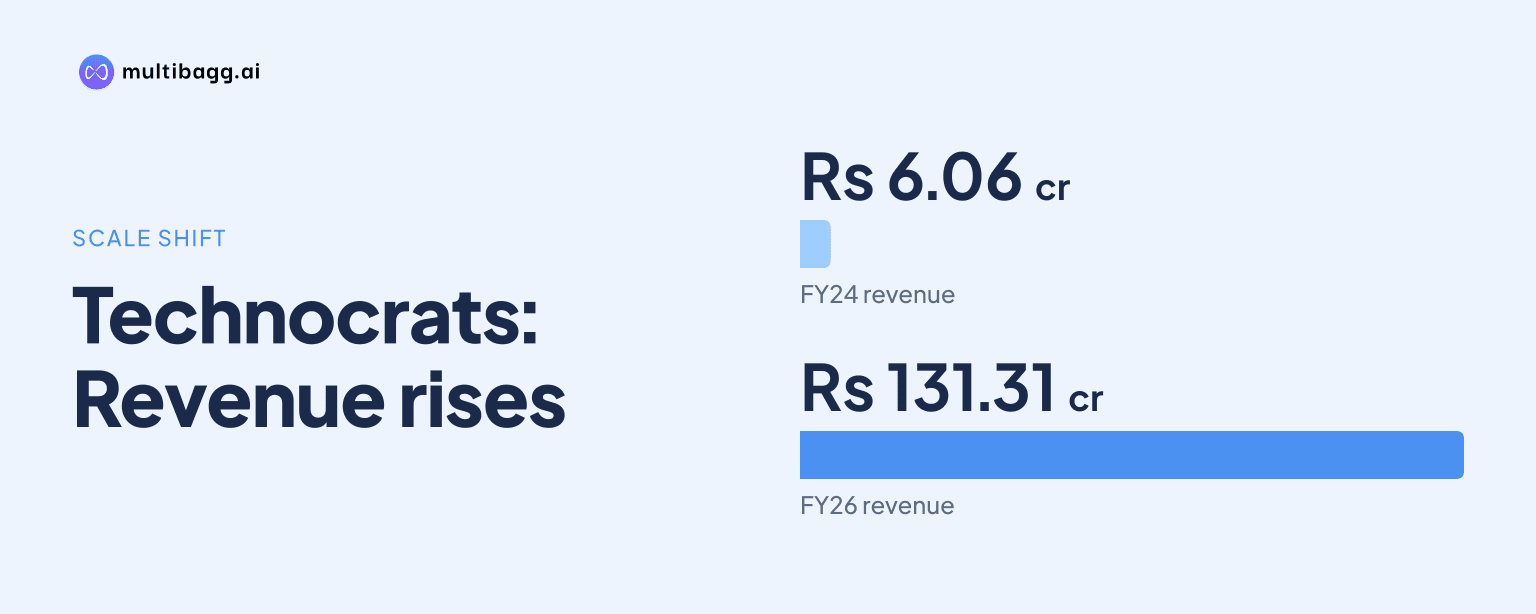
Technocrats increased revenue from Rs 6.062 crore in FY24 to Rs 131.309 crore in FY26, a 21.7-times rise in two years, while EBITDA margin moved from 21.4% to 20.0% and then fell to 16.5% in H1 FY27. Annualised H1 FY27 return measures were also below FY26 levels.
Know Technocrats Plasma Systems inside out
Results, valuation, peers and who's buying, in one view.
How quickly did Technocrats’ revenue and profit scale?
Technocrats’ revenue scaled from Rs 6.062 crore in FY24 to Rs 49.357 crore in FY25 and Rs 131.309 crore in FY26. H1 FY27 revenue was Rs 103.551 crore, compared with Rs 52.470 crore in H1 FY26, representing the presentation’s stated year-on-year increase of 97.4%.
Earnings increased in absolute terms during H1 FY27, although they rose more slowly than revenue. Earnings before interest, tax, depreciation and amortisation, or EBITDA, increased 78.0% year on year to Rs 17.039 crore from Rs 9.572 crore. Profit after tax, or PAT, rose 50.8% to Rs 11.948 crore from Rs 7.923 crore, while earnings per share increased to Rs 8.6 from Rs 6.2.
The presentation reports differing FY25 EBITDA and PAT figures across its historical-performance pages and income statement. The historical page gives EBITDA of Rs 8.593 crore and PAT of Rs 8.110 crore, while the income statement gives Rs 8.827 crore and Rs 6.536 crore, respectively. It also shows FY25 EBITDA margin of 17.4% and PAT margin of 16.4% on the historical page, compared with 17.9% and 13.2% in the income statement.
Why did Technocrats’ margins decline?
Technocrats’ gross profit margin declined to 23.9% in FY26 from 60.2% in FY24, before moving to 24.2% in H1 FY27. EBITDA margin fell from 21.4% in FY24 to 17.4% in FY25, recovered to 20.0% in FY26 and then declined to 16.5% in H1 FY27.
The H1 FY27 income statement shows that material costs increased faster than revenue. Cost of materials consumed, including changes in work in progress and finished goods, rose 108.3% year on year to Rs 82.590 crore, while revenue rose 97.4% to Rs 103.551 crore. Employee benefit expenses increased 677.8% to Rs 1.551 crore, whereas other expenses decreased 22.1% to Rs 2.370 crore; the presentation does not identify a specific cause for the margin movement.
PAT margin declined from 36.4% in FY24 to 11.4% in FY26 and was 11.5% in H1 FY27. Finance costs more than doubled year on year to Rs 97.7 lakh from Rs 48.2 lakh, while tax expense rose 240.3% to Rs 4.027 crore. These reported cost lines accompanied a 356-basis-point fall in PAT margin from 15.1% in H1 FY26.
Got a follow-up? Ask IRIS
How did Technocrats’ returns, leverage and cash flow change?
Technocrats reported return on equity, or ROE, of 56.1% in FY26 and an annualised ROE of 23.1% in H1 FY27, below the 90.2% recorded in FY25. Return on capital employed, or RoCE, moved from 48.5% in FY26 to an annualised 28.9% in H1 FY27, after rising from 11.3% in FY24 to 34.6% in FY25. The presentation specifies that H1 FY27 ROE and RoCE are annualised rather than full-year results.
The debt-to-equity ratio declined from 1.8 times in FY24 to 0.1 times in H1 FY27. Shareholders’ funds rose to Rs 103.579 crore at H1 FY27 from Rs 39.006 crore at FY26, while H1 FY27 proceeds from issue of capital were Rs 52.626 crore. Long-term borrowings were Rs 13.156 crore at H1 FY27, compared with Rs 7.972 crore at FY26.
Operating cash flow remained negative despite H1 FY27 profit before tax of Rs 15.975 crore. Net cash used in operating activities was Rs 50.397 crore, compared with Rs 10.369 crore used in H1 FY26, after increases of Rs 47.167 crore in trade receivables, Rs 19.493 crore in inventories and Rs 29.172 crore in other working-capital adjustments. Capacity utilisation was about 75.0% in H1 FY27, up from 50.1% in FY26.
What could shape Technocrats’ next performance phase?
Technocrats plans to broaden its portfolio through higher-end plasma cutting systems, computer numerical control, or CNC, integrated models, automation-ready welding solutions, and laser cutting and welding technologies. These plans follow capital expenditure of Rs 1.053 crore in FY26 and Rs 1.9 lakh in H1 FY27, while management says capacity additions will be phased according to business requirements.
Technocrats also intends to expand its domestic dealer, service and technical-support network across emerging industrial clusters and Tier II and III manufacturing hubs. Its after-sales plan includes preventive-maintenance programmes, annual maintenance contracts, digital service tools and enhanced field support infrastructure. Management identifies production planning, material utilisation and lead-time reduction as operational-efficiency priorities, but the presentation gives no numerical savings target or timetable.
Exports are another stated development area, although Cameroon and Uganda together contributed 0.55% of FY25 revenue. Technocrats says it will explore South Asia, Africa and the Middle East through distributor partnerships, industry engagement and reference-building initiatives. The presentation discloses no export-revenue target, leaving the eventual financial contribution unspecified.
Conclusion
Technocrats’ figures show that revenue expanded from Rs 6.062 crore in FY24 to Rs 131.309 crore in FY26, while profit also increased in absolute terms. However, gross profit margin fell by 36.3 percentage points over that period, H1 FY27 EBITDA margin was 16.5%, and annualised H1 FY27 ROE and RoCE were below their FY26 readings.
The next reporting periods will show whether about 75.0% capacity utilisation, network expansion and the planned higher-end cutting, welding and automation portfolio affect operating results. The stated phased-capacity approach and working-capital position also remain relevant, with H1 FY27 trade receivables at Rs 68.142 crore, inventories at Rs 52.676 crore and operating cash flow negative at Rs 50.397 crore.