










Timex Group India Q2 income rises 47% and margin hits 18.2%
Key highlights
- TGIL reported Q2 FY2026-27 total income of Rs 359.17 crore, up 47% from Rs 244.04 crore.
- TGIL’s Q2 FY2026-27 EBITDA was Rs 65.50 crore and EBITDA margin rose to 18.2% from 17.6%.
- TGIL reported Q2 FY2026-27 PBT of Rs 63.34 crore, compared with Rs 40.69 crore a year earlier.
- TGIL’s H1 FY2026-27 income was Rs 578.62 crore and EBITDA margin was 17.5%.
powered by IRIS
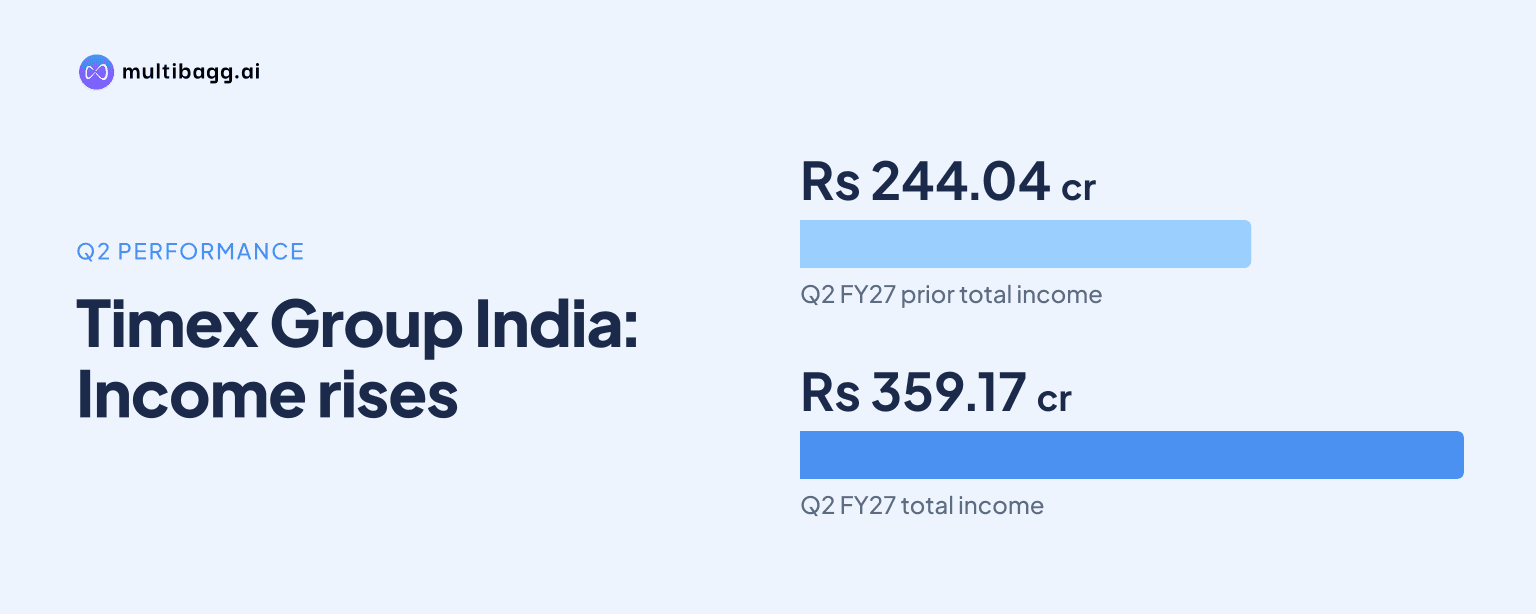
Timex Group India reported total income of Rs 359.17 crore for Q2 FY2026-27, up 47% from the corresponding quarter a year earlier, while EBITDA margin increased to 18.2% from 17.6%. For the quarter ended 30 September 2026, EBITDA reached Rs 65.50 crore and profit before tax was Rs 63.34 crore.
Know Timex Group India inside out
Results, valuation, peers and who's buying, in one view.
What did TGIL report for Q2 FY2026-27?
TGIL reported Q2 FY2026-27 total income of Rs 359.17 crore, compared with Rs 244.04 crore in Q2 FY2025-26. The Rs 115.13 crore increase matches the company’s stated 47% growth rate for the quarter ended 30 September 2026. Q2 refers to the second quarter and FY refers to the financial year.
TGIL’s earnings before interest, tax, depreciation and amortisation, or EBITDA, rose by Rs 22.59 crore year on year to Rs 65.50 crore. The presentation describes quarterly EBITDA as reaching 1.5 times the prior-year level of Rs 42.91 crore. Both total income and EBITDA increased over the comparable Q2 periods.
Profit before tax, or PBT, was Rs 63.34 crore in Q2 FY2026-27, against Rs 40.69 crore in Q2 FY2025-26. That was a Rs 22.65 crore increase, and TGIL described quarterly PBT as growing to 1.6 times the previous year’s amount. The presentation separately reports Q2 income, EBITDA and PBT but does not explain the drivers of each movement.
How did TGIL’s Q2 EBITDA margin change?
TGIL’s Q2 EBITDA margin rose by 0.6 percentage points to 18.2% in FY2026-27 from 17.6% in FY2025-26. The change occurred as total income increased 47% to Rs 359.17 crore and EBITDA increased to Rs 65.50 crore in the quarter ended 30 September 2026.
The margin comparison is directly between Q2 FY2026-27 and Q2 FY2025-26, unlike a comparison with the 14.5% EBITDA margin reported for the full FY2025-26. TGIL’s annual trend chart shows FY2025-26 EBITDA of Rs 116.14 crore on total income of Rs 800.63 crore, but that full-year period is not comparable with one quarter.
TGIL also reported a higher first-half EBITDA margin of 17.5% for H1 FY2026-27, compared with 15.7% in H1 FY2025-26. The 1.8-percentage-point first-half increase was larger than the 0.6-percentage-point Q2 increase, although the two comparisons cover different reporting periods.
How much did TGIL spend on advertising and royalty?
TGIL reported advertising and sales-promotion expense of Rs 25.75 crore in Q2 FY2026-27, up from Rs 16.35 crore in the corresponding prior-year quarter. The Rs 9.40 crore increase was included within other expenses in the company’s presentation.
Royalty included in other expenses rose to Rs 15.51 crore in Q2 FY2026-27 from Rs 10.53 crore a year earlier, an increase of Rs 4.98 crore. Together, the disclosed advertising, sales-promotion and royalty items totalled Rs 41.26 crore, compared with Rs 26.88 crore in Q2 FY2025-26.
For H1 FY2026-27, TGIL reported advertising and sales-promotion expense of Rs 44.39 crore, versus Rs 28.81 crore in H1 FY2025-26. First-half royalty was Rs 23.54 crore, compared with Rs 17.60 crore a year earlier. The presentation does not attribute the 17.5% H1 EBITDA margin to any individual expense item.
Got a follow-up? Ask IRIS
What were TGIL’s H1 FY2026-27 results?
TGIL reported H1 FY2026-27 total income of Rs 578.62 crore, up 40% from Rs 413.29 crore in H1 FY2025-26. H1 refers to the half-year ended 30 September 2026, and the income increase was Rs 165.33 crore.
H1 EBITDA rose by Rs 36.42 crore to Rs 101.28 crore from Rs 64.86 crore. TGIL described the first-half EBITDA figure as 1.6 times the prior-year amount, while reported EBITDA margin increased by 1.8 percentage points to 17.5%.
H1 PBT was Rs 97.12 crore, compared with Rs 60.56 crore in H1 FY2025-26, a rise of Rs 36.56 crore. Q2 accounted for Rs 359.17 crore of the Rs 578.62 crore H1 income total, leaving Rs 219.45 crore for the other quarter in the reported half-year.
How does TGIL’s recent performance compare with annual trends?
TGIL’s total income rose to Rs 800.63 crore in FY2025-26 from Rs 539.82 crore in FY2024-25, an increase of Rs 260.81 crore. EBITDA increased to Rs 116.14 crore from Rs 49.68 crore, while the annual EBITDA margin rose to 14.5% from 9.2%.
The annual trend shows total income of Rs 421.68 crore in FY2023-24 and Rs 383.78 crore in FY2022-23 before FY2024-25 and FY2025-26 growth. EBITDA was Rs 35.17 crore in FY2023-24, below Rs 38.59 crore in FY2022-23, before rising in the following two financial years.
TGIL notes that FY2021-22 operations and financial results were adversely affected by Covid-19 and are not strictly comparable. Total income for that year was Rs 265.54 crore, EBITDA was Rs 8.69 crore and EBITDA margin was 3.3%.
Conclusion
TGIL’s Q2 FY2026-27 results combined 47% total-income growth with a 0.6-percentage-point increase in EBITDA margin to 18.2%. The company also reported higher EBITDA and PBT in both Q2 and H1, while disclosed advertising, sales-promotion and royalty costs increased year on year.
The presentation provides no FY2026-27 income, EBITDA or margin target. The unresolved issue for subsequent disclosures is whether TGIL can maintain the H1 FY2026-27 EBITDA margin of 17.5% as advertising, sales-promotion and royalty expenses continue above the prior-year levels.