










Tonbo Imaging Q2 revenue of Rs 183.3 crore restores H1 profit
Key highlights
- Tonbo reported Q2 FY27 revenue of Rs 183.3 crore, versus Rs 36 crore in Q1 FY27.
- Q2 FY27 PAT was Rs 23.5 crore after a Rs 17.7 crore loss in Q1 FY27.
- H1 FY27 revenue reached Rs 219.3 crore and PAT was Rs 5.8 crore, versus a Rs 4.2 crore H1 FY26 loss.
- Tonbo’s Q2 FY27 confirmed order book was Rs 249.8 crore, including Rs 205.3 crore of platform orders.
powered by IRIS
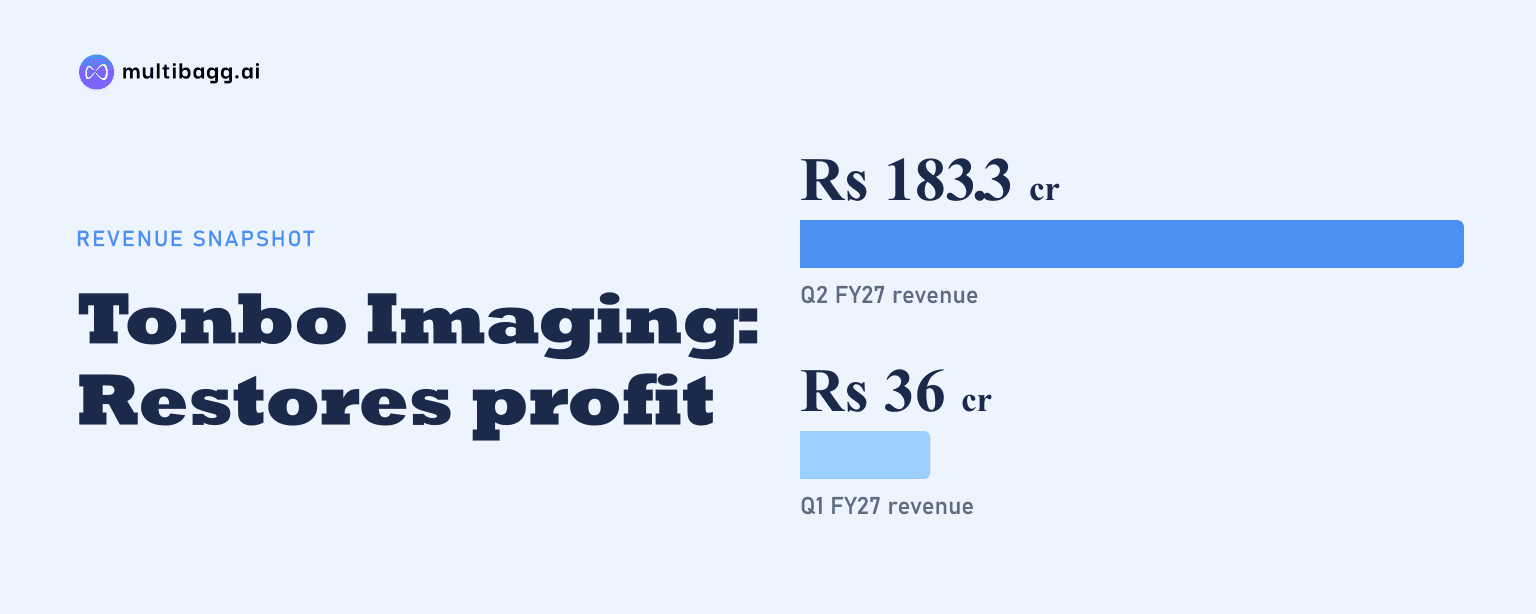
Tonbo reported Rs 183.3 crore of revenue from operations and Rs 23.5 crore of profit after tax in Q2 FY27, reversing its Q1 FY27 loss and taking H1 FY27 profit to Rs 5.8 crore. Q2 supplied most of H1 revenue of Rs 219.3 crore after Q1 revenue of Rs 36 crore.
Know Tonbo Imaging India inside out
Results, valuation, peers and who's buying, in one view.
How did Tonbo’s Q2 FY27 performance reverse the first-quarter loss?
Tonbo’s Q2 FY27 revenue was Rs 183.3 crore, compared with Rs 36 crore in Q1 FY27, while profit after tax, or PAT, changed from a Rs 17.7 crore loss to a Rs 23.5 crore profit. Earnings before interest, tax, depreciation and amortisation, or EBITDA, which Tonbo calculates excluding other income, moved from a Rs 13 crore loss in Q1 to a Rs 44.2 crore profit in Q2.
The quarterly revenue change also lifted Q2 operating margins. Gross profit was Rs 62.4 crore at a 34% gross margin, versus Rs 13.6 crore and a 38% margin in Q1. EBITDA margin improved to 24% from negative 36%, while PAT margin moved to 13% from negative 48%; the presentation reports these Q2 and Q1 measures without annualising them.
The comparative income statement records Q2 FY27 revenue growth of 1,963.2% from Rs 8.9 crore in Q2 FY26. Total income was Rs 185.2 crore, including Rs 1.9 crore of other income, while total expenses were Rs 153.7 crore. Cost of materials consumed was Rs 84 crore, changes in inventories of finished goods were Rs 36.9 crore, and depreciation and amortisation was Rs 9.8 crore.
What did Tonbo report for H1 FY27 versus H1 FY26?
Tonbo reported H1 FY27 revenue of Rs 219.3 crore, up from Rs 77.6 crore in H1 FY26, and PAT of Rs 5.8 crore after a Rs 4.2 crore loss a year earlier. The half-year’s total income rose 172.7% to Rs 222.5 crore, while total expenses increased 153.8% to Rs 214.8 crore, producing Rs 7.7 crore of profit before tax.
Gross profit increased in rupee terms to Rs 75.9 crore from Rs 40.7 crore, but gross margin declined to 34.62% from 52.45%. EBITDA increased from Rs 11.8 crore to Rs 31.2 crore, while its margin fell to 14.20% from 15.16%. The H1 profit recovery therefore occurred alongside lower gross and EBITDA margins than in the prior first half.
The H1 FY27 margin profile was also below Tonbo’s reported full-year FY26 levels. Gross margin was 35% in H1 FY27 versus 51% in FY26, EBITDA margin was 14% versus 29%, and PAT margin was 3% versus 14%. These are reported-period comparisons rather than management guidance on the full FY27 outcome.
Got a follow-up? Ask IRIS
Which products and geographies contributed to H1 FY27 revenue?
Tonbo’s tactical products contributed Rs 122.9 crore of H1 FY27 product-category revenue and platform products contributed Rs 94.1 crore, compared with Rs 39.3 crore and Rs 33.3 crore respectively in H1 FY26. The two categories together accounted for Rs 217 crore in H1 FY27, versus Rs 72.6 crore a year earlier. Other products contributed Rs 50 lakh in H1 FY27.
India accounted for Rs 139.3 crore of H1 FY27 geographic revenue, the United States accounted for Rs 61.5 crore, and the Middle East and Africa grouping accounted for Rs 16.1 crore. India generated Rs 68.7 crore in H1 FY26, while the Middle East and Africa grouping generated Rs 4.2 crore. Asia-Pacific revenue was Rs 60 lakh in H1 FY27, and the presentation recorded no Europe revenue for the period.
Export share was 36% of H1 FY27 revenue, following 43% in Q2 FY27 and 0.3% in Q1 FY27. The change in export share coincided with the increase in quarterly revenue from Rs 36 crore to Rs 183.3 crore. The presentation does not identify individual contracts or provide a stated explanation for the timing of quarterly revenue.
What do Tonbo’s order book and working-capital figures show?
Tonbo’s confirmed order book stood at Rs 249.8 crore in Q2 FY27, down from Rs 314.2 crore in Q1 FY27 and below Rs 279 crore at FY26. The Q2 balance comprised Rs 182.2 crore of domestic orders and Rs 67.6 crore of export orders. By product category, platform orders were Rs 205.3 crore and tactical orders were Rs 44.5 crore.
Working-capital days fell to 238 in Q2 FY27 from 1,454 in Q1 FY27, while the H1 FY27 measure was 454 days. At September 30, 2026, inventories were Rs 265.9 crore compared with Rs 138.8 crore a year earlier, and trade receivables were Rs 235.6 crore compared with Rs 75.5 crore. Total assets increased to Rs 848.4 crore from Rs 608.4 crore over the same dates.
H1 FY27 net cash used in operating activities was Rs 48.4 crore, following Rs 63.2 crore used in FY26. The H1 cash-flow statement shows Rs 46.4 crore used for an inventory increase and Rs 23.4 crore for a receivables increase, partly offset by a Rs 15.6 crore increase in trade payables. Short-term borrowings were Rs 147.3 crore at September 30, 2026, versus Rs 40.6 crore a year earlier.
Conclusion
Tonbo’s Q2 FY27 result changed the first-half outcome from a Q1 loss: Rs 183.3 crore of quarterly revenue generated Rs 23.5 crore of quarterly PAT and left H1 with Rs 5.8 crore of profit. However, H1 gross margin of 34.62% and EBITDA margin of 14.20% were below both H1 FY26 and FY26 levels, while operating cash flow remained negative at Rs 48.4 crore.
The next reported period will show whether Tonbo converts its Rs 249.8 crore confirmed order book, particularly the Rs 205.3 crore platform portion, into revenue. Working-capital execution also remains a disclosed matter to monitor, given inventories of Rs 265.9 crore, receivables of Rs 235.6 crore and short-term borrowings of Rs 147.3 crore at September 30, 2026.