










UDS FY26 revenue nearly doubled while EBITDA margin fell
Key highlights
- UDS revenue from operations rose to Rs 2,939.51 crore in FY26 from Rs 1,483.60 crore in FY22.
- UDS reported EBITDA fell to Rs 134.17 crore in FY26 from Rs 166.54 crore in FY25, reducing the EBITDA margin to 4.6%.
- UDS operating cash flow increased to Rs 143.65 crore in FY26 from Rs 50.84 crore in FY25 as working-capital outflow narrowed to Rs 5.45 crore.
- UDS reported ROCE declined to 14.9% in FY26 from 22.1% in FY25, while net debt to equity remained at negative 0.2.
powered by IRIS
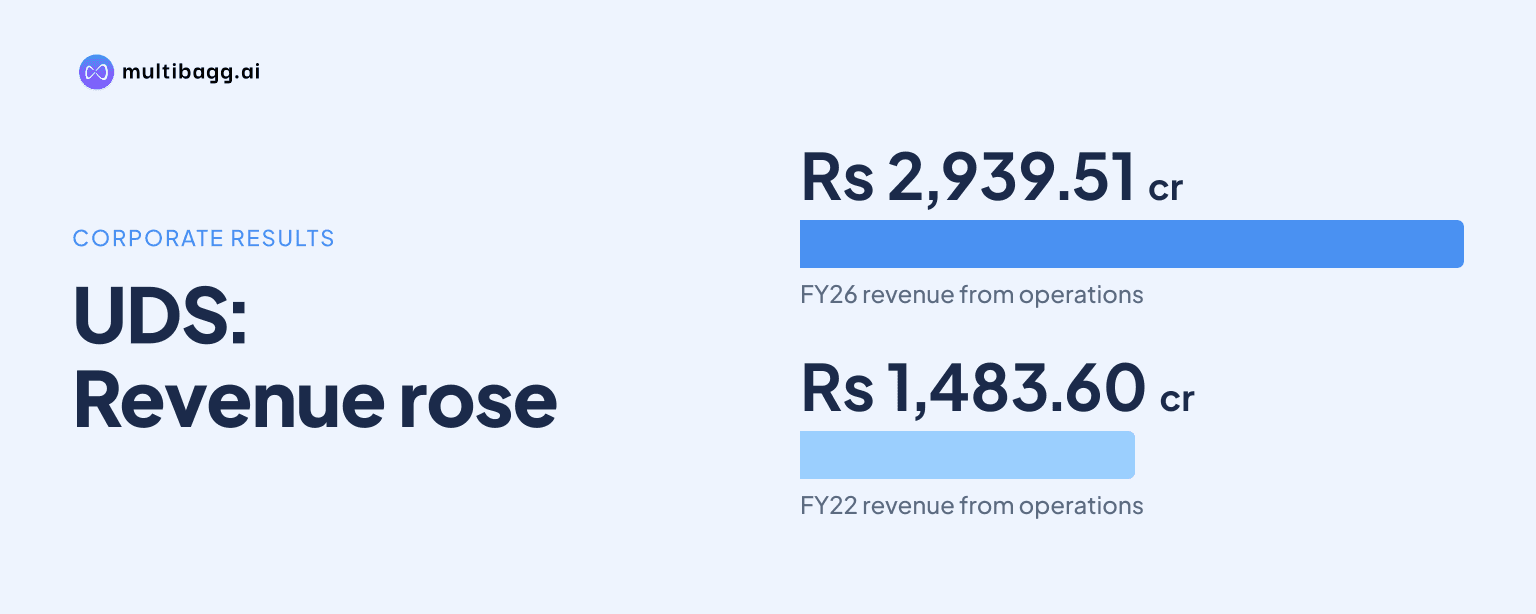
Updater Services Limited (UDS) increased revenue from operations from Rs 1,483.60 crore in FY22 to Rs 2,939.51 crore in FY26, but reported profitability and returns declined in the latest year. Reported EBITDA margin fell to 4.6% from 6.1% in FY25, while return on capital employed, or ROCE, declined to 14.9% from 22.1%.
Know Updater Services inside out
Results, valuation, peers and who's buying, in one view.
How much did UDS revenue grow between FY22 and FY26?
UDS added Rs 1,455.91 crore of revenue between FY22 and FY26, taking revenue from operations to Rs 2,939.51 crore from Rs 1,483.60 crore. FY26 revenue was Rs 203.45 crore higher than Rs 2,736.06 crore in FY25, extending the increase recorded from Rs 2,444.36 crore in FY24.
The five-year financial record shows revenue rising in every reported year, although the presentation contains two FY23 figures. Its summary page lists FY23 revenue at Rs 2,098.90 crore, while the consolidated profit and loss statement gives Rs 2,088.48 crore. Both figures are above FY22 revenue, and the FY26 amount is the highest reported in the series.
What was UDS's FY26 revenue mix by business?
UDS reported integrated facility management, or IFM, revenue of Rs 1,982.30 crore in FY26, representing 67% of sales before adjustments and eliminations. IFM revenue increased by Rs 190.70 crore from Rs 1,791.60 crore in FY25, while its share of sales recovered from 65% in FY25 but remained below 80% in FY22.
Business support services, or BSS, reported revenue of Rs 957.10 crore in FY26, or 33% of sales before adjustments and eliminations. That was Rs 12.70 crore above FY25 BSS revenue of Rs 944.40 crore; BSS represented 20% of sales in FY22 and 35% in FY25. IFM therefore remained the larger disclosed business in FY26, with more than twice BSS revenue.
The presentation states that both segment figures are before adjustments and eliminations. Their FY26 combined value was Rs 2,939.40 crore, close to but not identical to consolidated revenue from operations of Rs 2,939.51 crore. The segment data therefore describes the sales mix but does not provide a direct consolidated reconciliation.
Why did UDS reported EBITDA and PAT decline in FY26?
UDS reported earnings before interest, tax, depreciation and amortisation, or EBITDA, of Rs 134.17 crore in FY26, down Rs 32.37 crore from Rs 166.54 crore in FY25. Reported EBITDA margin consequently declined by 1.5 percentage points to 4.6%, despite the Rs 203.45 crore rise in revenue. FY26 reported EBITDA was also marginally below Rs 134.22 crore in FY24.
Employee benefits expense, including employee stock option plan, or ESOP, expense, increased to Rs 2,294.80 crore in FY26 from Rs 2,040.27 crore in FY25. Impairment losses on financial instruments and contract assets rose to Rs 29.32 crore from Rs 13.14 crore, while other expenses decreased to Rs 383.94 crore from Rs 425.00 crore. The consolidated statement also records Rs 2.65 crore of fair-value changes in a liability payable or paid to promoters of an acquired subsidiary.
Reported profit after tax, or PAT, fell to Rs 82.78 crore in FY26 from Rs 118.97 crore in FY25, reducing the PAT margin to 2.8% from 4.3%. Profit before tax was Rs 96.08 crore compared with Rs 144.72 crore a year earlier, and FY26 included Rs 5.36 crore of exceptional items. Separately, the summary page gives FY26 EBITDA of Rs 155.30 crore adjusted for a one-time Avon loss, rather than the Rs 134.17 crore reported EBITDA in the consolidated statement.
Got a follow-up? Ask IRIS
How did UDS operating cash flow change in FY26?
UDS generated net cash from operating activities of Rs 143.65 crore in Mar-26, compared with Rs 50.84 crore in Mar-25. Cash generated from operations before direct taxes was Rs 162.29 crore, up from Rs 97.66 crore, while net direct taxes paid declined to Rs 18.64 crore from Rs 46.83 crore.
Working-capital changes used Rs 5.45 crore in Mar-26, materially less than the Rs 87.92 crore use in Mar-25. Operating profit before working-capital changes was Rs 167.74 crore, below Rs 185.59 crore in the previous year. The cash-flow statement therefore shows higher operating cash generation after working-capital movements even as pre-working-capital operating profit declined.
Cash PAT was Rs 133.60 crore in FY26, down from Rs 169.00 crore in FY25. UDS defines cash PAT as reported PAT plus depreciation and amortisation, ESOP cost, and fair-value changes in the liability payable or paid to acquired-subsidiary promoters. Cash and cash equivalents rose to Rs 208.53 crore at Mar-26 from Rs 118.50 crore at Mar-25, while cash, mutual funds and fixed deposits together were Rs 375.41 crore.
How did UDS returns and balance sheet funding change?
UDS reported ROCE of 14.9% in FY26, down 7.2 percentage points from 22.1% in FY25 and 12.3 percentage points from 27.2% in FY22. The presentation does not provide a numerical bridge explaining the change. Total equity increased to Rs 1,055.82 crore at Mar-26 from Rs 964.61 crore at Mar-25, while total assets rose to Rs 1,639.83 crore from Rs 1,587.60 crore.
UDS remained a net-cash company under the presentation's measure, reporting net debt to equity of negative 0.2 in FY26, unchanged from FY25. Current borrowings fell to Rs 10 lakh at Mar-26 from Rs 48.43 crore a year earlier, and non-current borrowings were nil compared with Rs 3 lakh. The company says its net-debt calculation includes cash and cash equivalents, including bank balances, and bank deposits with maturities of more than 12 months.
Total liabilities decreased to Rs 584.02 crore at Mar-26 from Rs 622.99 crore at Mar-25. Trade receivables were Rs 602.61 crore, compared with Rs 608.19 crore a year earlier, while goodwill was unchanged at Rs 194.79 crore. These balance-sheet movements accompanied the FY26 declines in reported EBITDA, PAT, cash PAT and ROCE.
Conclusion
UDS's five-year record shows that revenue expansion did not translate into higher reported FY26 profitability. Revenue reached Rs 2,939.51 crore, nearly double the FY22 level, but reported EBITDA fell to Rs 134.17 crore, reported PAT fell to Rs 82.78 crore and ROCE declined to 14.9%. Operating cash flow nevertheless increased to Rs 143.65 crore as working-capital outflow reduced.
The next results will need to clarify the difference between reported FY26 EBITDA and the Rs 155.30 crore figure adjusted for the one-time Avon loss. The disclosed measures to watch are employee benefits expense of Rs 2,294.80 crore, impairment losses of Rs 29.32 crore, working-capital movements and the continued net debt-to-equity ratio of negative 0.2.