










V-MARC India Ltd H1 FY27 growth leaves operating cash negative
Key highlights
- V-MARC reported an operating cash outflow of Rs 45.67 crore in H1 FY27, against an inflow of Rs 114.22 crore in FY26.
- Inventory increased by Rs 222.7 crore and trade receivables increased by Rs 124.9 crore from FY26-end to September 2026.
- V-MARC raised Rs 146.2 crore of net borrowings in H1 FY27, and debt-to-equity reached 0.99 times at September 2026.
- H1 FY27 revenue rose 84.4% to Rs 1,275.36 crore and profit after tax rose 103.8% to Rs 76.43 crore.
powered by IRIS
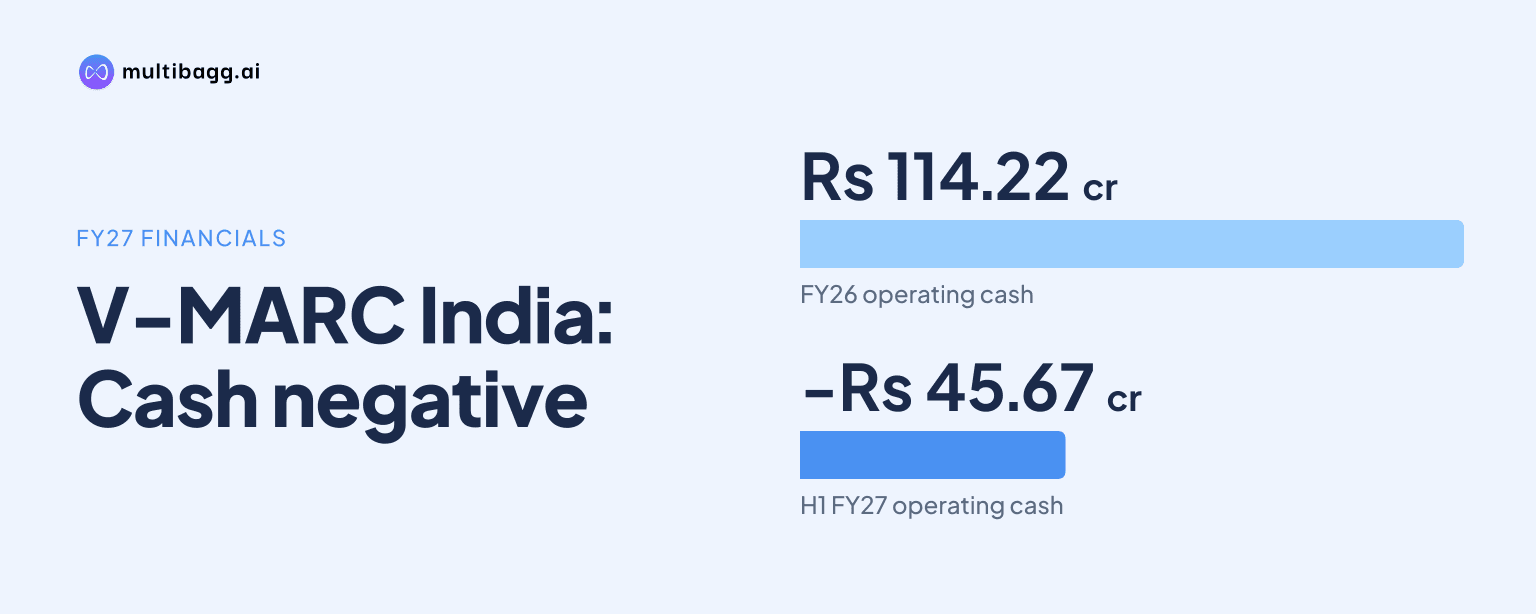
V-MARC India Ltd recorded an operating cash outflow of Rs 45.67 crore in H1 FY27 despite profit before tax of Rs 102.59 crore, as inventory and receivables rose by Rs 222.7 crore and Rs 124.9 crore since March 2026. Revenue grew 84.4% year on year to Rs 1,275.36 crore, while net borrowings raised were Rs 146.2 crore.
Know V-Marc India inside out
Results, valuation, peers and who's buying, in one view.
Why did V-MARC’s operating cash flow turn negative in H1 FY27?
V-MARC’s operating cash flow turned negative because working-capital absorption exceeded the cash generated before those movements. Profit before tax was Rs 102.59 crore and operating profit before working capital was Rs 148.92 crore in H1 FY27, but net cash from operations was an outflow of Rs 45.67 crore. This compares with cash inflows of Rs 114.22 crore in FY26, Rs 22.53 crore in FY25 and Rs 23.13 crore in FY24.
The largest balance-sheet movements were in inventory and trade receivables as the business expanded. Inventory increased from Rs 266.13 crore at the end of FY26 to Rs 488.84 crore at September 2026, while receivables rose from Rs 418.58 crore to Rs 543.50 crore. Trade payables also increased, from Rs 433.38 crore to Rs 625.91 crore, partly funding the rise in current assets.
Working-capital days show that inventory was the principal deterioration. Inventory days increased to 70 in H1 FY27 from 54 in FY26, while payable days were broadly stable at 89 days compared with 88 days. Debtor days fell to 78 from 85, indicating faster collections relative to H1 revenue even though the receivables balance rose in rupee terms; management said tightening cash conversion is a priority for H2.
How fast did V-MARC’s revenue and profit expand?
V-MARC’s revenue rose 84.4% year on year to Rs 1,275.36 crore in H1 FY27, while profit after tax increased 103.8% to Rs 76.43 crore. Earnings before interest, tax, depreciation and amortisation, or EBITDA, rose 84.3% to Rs 147.33 crore. EBITDA margin was 11.6%, broadly unchanged year on year, while profit-after-tax margin increased by 57 basis points to 6.0%.
Building wires and industrial cables produced the fastest product growth. Revenue from that category rose 180.6% to Rs 485.40 crore in H1 FY27 from Rs 173 crore in H1 FY26, ahead of the 62.4% increase in high-tension, or HT, cables to Rs 585.30 crore. Low-tension, or LT, cables increased 29.3% to Rs 204.60 crore; HT cables represented 46% of standalone H1 FY27 revenue.
Customer-channel growth was also uneven. Business-to-government, or B2G, revenue increased 86.9% to Rs 453.60 crore, while business-to-business engineering, procurement and construction, or B2B EPC, revenue rose 75.5% to Rs 432.60 crore. Exports rose to Rs 181.40 crore from Rs 1.36 crore after exports began in FY26, while dealer-led B2C revenue increased 3.0% to Rs 207.70 crore.
Got a follow-up? Ask IRIS
What investment spending accompanied V-MARC’s growth?
V-MARC spent Rs 106.4 crore on capital expenditure in H1 FY27, including purchases of property, plant and equipment and capital work-in-progress. Net of disposals, capital expenditure was Rs 89.4 crore, while investing cash flow was an outflow of Rs 104.97 crore. Property, plant and equipment increased to Rs 226.22 crore at September 2026 from Rs 200.07 crore at FY26-end, and capital work-in-progress rose to Rs 57.33 crore from Rs 36.30 crore.
The spending followed a multi-year expansion in production capacity. Capacity increased from 63,000 kilometres in FY23 to 212,600 kilometres in FY26, while annual revenue rose from Rs 247.30 crore to Rs 1,797 crore over the same period. Annual EBITDA increased from Rs 24.70 crore to Rs 202.20 crore, and the presentation reports a 93.7% three-year compound annual growth rate for total revenue from FY23 to FY26.
Management linked the H1 FY27 capital expenditure and working-capital increase to higher volumes. It raised FY27 revenue-growth guidance to 60% or more from 40% or more, with H1 revenue equal to 44% of the Rs 2,875.70 crore revenue implied by the revised target. Management retained EBITDA-margin guidance of 11% to 12%, compared with the 11.6% margin reported in H1 FY27.
How did V-MARC fund working capital and capex?
V-MARC funded the cash deficit primarily through financing inflows, including Rs 146.2 crore of net borrowings raised in H1 FY27. Financing cash flow was Rs 143.29 crore, compared with an outflow of Rs 5.26 crore in FY26. Closing cash and bank balances fell to Rs 1.49 crore at September 2026 from Rs 8.84 crore at March 2026 after operating and investing outflows.
Borrowings increased in both long-term and short-term categories. Long-term borrowings rose to Rs 222.78 crore at September 2026 from Rs 106.94 crore at FY26-end, while short-term borrowings rose to Rs 137.04 crore from Rs 106.72 crore. Total borrowings excluding leases were therefore Rs 359.82 crore at September 2026, and the presentation reports net debt excluding leases of Rs 358.30 crore.
V-MARC’s debt-to-equity ratio, excluding leases, rose to 0.99 times at September 2026 from 0.74 times at FY26-end, although it remained below the 1.32 times reported in FY24. Total equity increased to Rs 365.26 crore from Rs 288.91 crore, while total assets rose to Rs 1,508.95 crore from Rs 1,030.68 crore. Equity share capital increased to Rs 146.52 crore following a 5:1 bonus issue from reserves.
Conclusion
V-MARC’s H1 FY27 figures show profits and revenue rising rapidly while operating cash conversion moved in the opposite direction. The Rs 45.67 crore operating cash outflow reflected higher inventory and receivables, alongside Rs 106.4 crore of capital expenditure, with higher payables and Rs 146.2 crore of net borrowings providing partial funding.
The next disclosure to watch is progress on management’s stated H2 priority of tighter cash conversion while pursuing FY27 revenue growth of 60% or more. Inventory days were 70 in H1 FY27 versus 54 in FY26, debt-to-equity was 0.99 times at September 2026, and management maintained its 11% to 12% EBITDA-margin target.