










Varun Beverages: packaging costs cut Q3 gross margin 334 bps
Key highlights
- Varun Beverages’ Q3 CY2026 gross margin fell 334 basis points year on year to 53.1%.
- Higher packaging costs contributed about 300 basis points of Q3 CY2026 gross-margin pressure.
- Low-sugar and no-sugar products reached 88% of India volume, compared with 44% in Q3 CY2025.
- Q3 CY2026 EBITDA rose 25.1% to Rs 1,426.71 crore, while EBITDA margin declined 140 basis points to 21.6%.
powered by IRIS
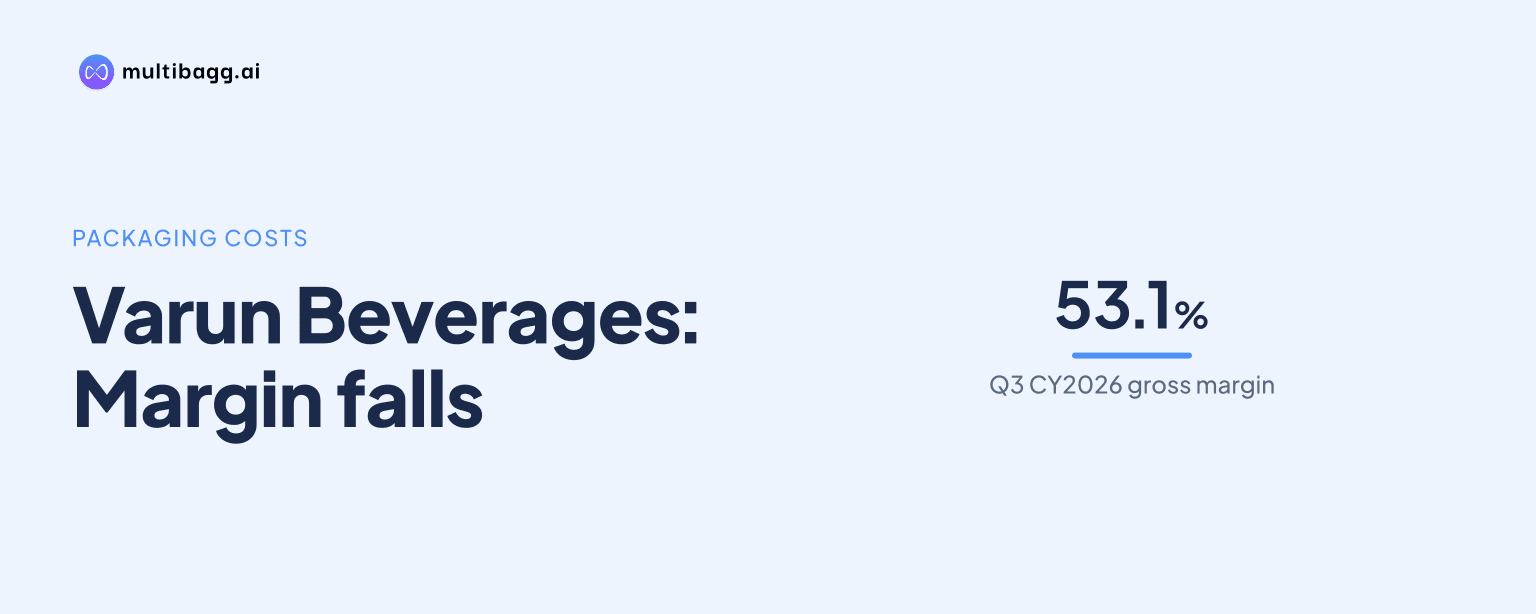
Varun Beverages Limited reported that gross margin fell 334 basis points year on year to 53.1% in Q3 CY2026, principally because higher packaging costs created about 300 basis points of pressure. Management said it had mitigated more than half of the estimated 3%-4% material-cost impact through cost reductions.
Know Varun Beverages inside out
Results, valuation, peers and who's buying, in one view.
Why did Varun Beverages’ Q3 gross margin decline?
Varun Beverages’ gross margin declined because geopolitical disruptions raised the cost of packaging materials, including preforms, shrink films, closures and cans. Gross margin was 53.1% in Q3 CY2026, down 334 basis points, or 3.34 percentage points, from the corresponding quarter, with packaging costs accounting for about 300 basis points of the pressure.
The increase reached the profit and loss account after earlier inventory cover ran out. Management said its prior statement on being covered for the next quarter applied until the war began around February 28, and it had not stocked inventory beyond Q2. It said gross margin was unaffected in the previous quarter, but purchases made subsequently were at higher prices and were consumed in Q3.
How did sugar costs affect Varun Beverages’ margin?
Sugar was not a significant net driver of Varun Beverages’ Q3 CY2026 margin movement, according to management. Sugar prices rose about 16%, but the share of low-sugar and no-sugar products in India increased to 88% in Q3 CY2026 from 44% in Q3 CY2025, helping offset the inflation.
The portfolio shift distinguishes food costs from packaging costs in the company’s explanation of the 334-basis-point decline. Management said the 88% low-sugar and no-sugar share was achieved after sharing sugar-reduction benefits with PepsiCo through concentrate costs. It attributed the main cost pressure to packaging rather than sugar, while continuing to describe portfolio innovation as a mitigation mechanism.
How much did non-beverage sales affect Varun Beverages’ margin?
Sales of non-beverage products, including preforms and caps in India, rose about 104% in Q3 CY2026 and lowered India gross margin by about 100 basis points. Varun Beverages said these products carry higher cost of goods sold than beverages, creating a separate mix effect on the India margin.
The 100-basis-point India effect should not be added directly to the approximately 300-basis-point packaging effect to calculate the 334-basis-point consolidated gross-margin decline. Management described the figures across different scopes, while higher beverage realization, country mix and operating factors also affected the consolidated result. Carbonated soft drinks represented 73.3% of Q3 volume, packaged drinking water 21.9% and juice-based drinks 4.8%.
Got a follow-up? Ask IRIS
What limited the EBITDA-margin decline at Varun Beverages?
Higher realization and operating leverage limited Varun Beverages’ EBITDA-margin decline to 140 basis points, less than the 334-basis-point reduction in gross margin. EBITDA increased 25.1% year on year to Rs 1,426.71 crore in Q3 CY2026, while the EBITDA margin was 21.6% and revenue from operations rose 33.2% to Rs 6,607.56 crore.
Volume growth was the main operating-leverage factor cited by management. India volume grew 22.5% and international volume grew 39.9%, producing consolidated volume growth of 28.7% to 354.4 million cases. Consolidated net realization per beverage case increased 2.2%, including a 0.5% rise in India, supported by dairy, Ad Rush, Evervess mixers, calibrated discounting and price-pack architecture.
What actions can Varun Beverages take if costs stay elevated?
Varun Beverages said it had already mitigated more than half of the estimated 3%-4% gross-margin impact from material costs through cost reductions, but it did not provide a target for the remaining exposure. Management said decisions on further action would depend on the geopolitical environment, fuel prices, market conditions and competitor behaviour over more than two quarters of higher costs.
One price-pack action has already been taken in the energy-drink range: Varun Beverages reduced Sting from 300 millilitres to 250 millilitres around May or June 2026. Management said it had not raised prices or changed pack sizes in the carbonated soft-drink portfolio during Q3. It also said about 25% of its PET supply was in-house recycled PET, or rPET, which was cheaper than virgin PET and helped contain costs.
Conclusion
The Q3 CY2026 margin movement was primarily a packaging-cost event rather than a sugar-cost event. Gross margin fell 334 basis points to 53.1%, while packaging contributed about 300 basis points of pressure and higher non-beverage sales reduced India gross margin by about 100 basis points. Volume growth, realization gains and operating leverage narrowed the EBITDA-margin decline to 140 basis points.
The next issue is whether packaging and fuel-linked costs remain elevated after Q3 CY2026. Management did not give numerical guidance for the December or March quarter, but identified further cost reductions, continued rPET use and potential price-pack or trade-margin measures as options if industry-wide cost pressure persists.