










Varun Beverages Limited Q3 Profit Rises 18.5% to ₹745 Crore
Key highlights
- VBL's Q3 CY2025 profit after tax rose 18.5% year on year to ₹745.2 crore.
- Revenue from operations increased 1.9% to ₹4,896.6 crore, while sales volume grew 2.4% to 273.8 million cases.
- EBITDA declined 0.3% to ₹1,147.3 crore, and EBITDA margin fell 53 basis points to 23.4%.
- International volumes increased 9% year on year, helping offset nearly flat domestic volumes during prolonged rainfall.
powered by IRIS
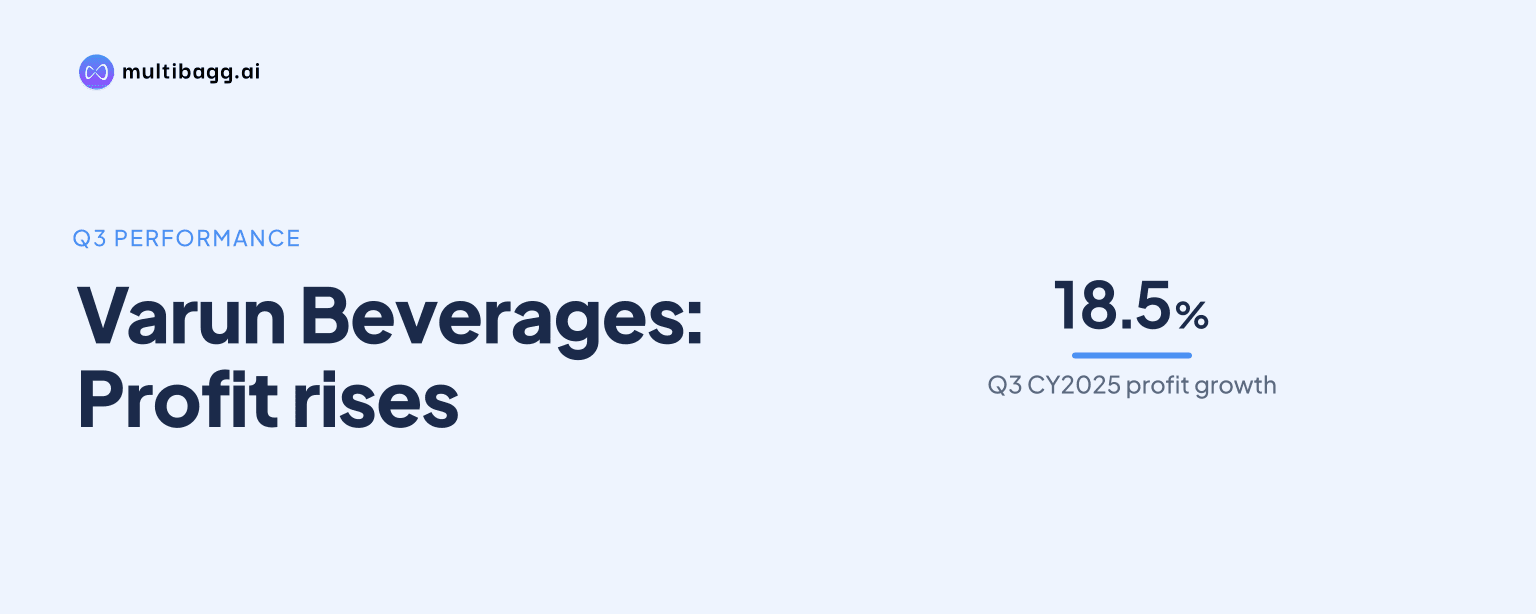
Varun Beverages Limited reported consolidated profit after tax of ₹745.2 crore for Q3 CY2025, an 18.5% increase from ₹628.8 crore a year earlier, despite subdued domestic beverage volumes during prolonged rainfall. Revenue from operations rose 1.9% to ₹4,896.6 crore, while consolidated sales volume increased 2.4% to 273.8 million cases.
Know Varun Beverages inside out
Results, valuation, peers and who's buying, in one view.
What did Varun Beverages report in Q3 CY2025?
Varun Beverages Limited, PepsiCo's largest bottling partner in India, reported a steady increase in quarterly profit even as revenue growth remained modest. The company follows the calendar year as its financial year, making the July-September period its third quarter of CY2025. VBL's profit after tax rose by ₹116.4 crore from the corresponding quarter of CY2024.
Revenue from operations, net of excise duty and GST, stood at ₹4,896.6 crore, compared with ₹4,804.7 crore in the year-earlier period. Sales volumes rose to 273.8 million cases from 267.5 million cases. The result shows that volume growth was maintained despite weather conditions that affected consumption in the domestic market.
The supplied results information puts earnings per share at ₹2.19 for Q3 CY2025, compared with ₹1.91 in Q3 CY2024. It also states that EPS was 7.5% above analyst estimates. The increase in profit was supported by lower finance costs and higher other income, including interest on deposits in India and favourable currency movements in international territories.
Why did domestic volumes remain subdued during the quarter?
VBL said prolonged rainfall across India affected domestic beverage consumption during the quarter. India volumes were nearly flat year on year, limiting the pace of overall revenue growth in a period when demand for carbonated drinks and packaged beverages is generally sensitive to weather conditions.
Chairman Ravi Jaipuria said consolidated volumes grew 2.4%, aided by healthy traction in international markets, while domestic volumes were subdued because of the extended rainfall. International operations recorded 9% volume growth, with South Africa identified as a key contributor to this performance.
The mix of domestic and international operations was therefore important during the period. International growth helped offset weakness in India, although the reported revenue increase of 1.9% remained below the rise in sales volumes. The available information does not provide a country-wise revenue break-up for the quarter.
How did Varun Beverages' operating margins change?
VBL's operating performance was broadly stable, but EBITDA and EBITDA margin were marginally lower than a year earlier. EBITDA declined 0.3% to ₹1,147.3 crore from ₹1,151.2 crore, while EBITDA margin fell 53 basis points to 23.4% from 24.0%.
The company attributed the margin movement primarily to higher other expenses. At the same time, gross margin improved by 119 basis points to 56.7%. This improvement was linked to changes in the expense mix of international operations and increased in-house backward integration initiatives.
The difference between the operating and net-profit trends is significant. EBITDA was slightly lower, but profit after tax rose 18.5%, reflecting the benefit from lower finance costs and higher other income. As a result, net profit growth did not come solely from core operating profit expansion during the quarter.
Got a follow-up? Ask IRIS
What does the Q3 result mean for investors and operations?
The quarter highlights the importance of VBL's international portfolio when domestic demand is affected by weather. International volume growth of 9% supported consolidated sales growth and reduced the effect of nearly flat India volumes. South Africa was specifically cited as a market that delivered strong performance.
For investors, the result presents contrasting operating and bottom-line indicators. Revenue growth was limited to 1.9%, EBITDA declined slightly, and the operating margin contracted. But reported profit after tax rose 18.5%, aided by lower finance costs and other income, while EPS of ₹2.19 exceeded the analyst estimate cited in the supplied results data by 7.5%.
The company remains a major bottling and distribution partner for PepsiCo beverages in India. Its volume performance is influenced by seasonal consumption patterns, rainfall and conditions in its overseas markets. The Q3 numbers show that higher gross margin did not fully prevent EBITDA margin pressure because of increased other expenses.
How do the Q3 figures compare with the previous year?
Compared with Q3 CY2024, VBL added ₹91.9 crore in revenue and ₹116.4 crore in profit after tax. The larger rise in profit than revenue reflects the effect of lower finance costs and higher other income, alongside a better gross-margin profile.
Sales volume increased by 6.3 million cases year on year, but the gain was driven mainly by overseas markets rather than India. The company did not disclose a forward-looking earnings target or a specific volume target in the supplied material. Its comments instead focused on the quarter's weather-related demand conditions and international market traction.
Conclusion
VBL delivered higher Q3 CY2025 profit despite a muted domestic demand environment. Profit after tax reached ₹745.2 crore, revenue from operations was ₹4,896.6 crore, and consolidated volume reached 273.8 million cases. International growth and lower finance costs supported the result, while EBITDA margin declined to 23.4%.
The next key factors to watch are the pace of domestic volume recovery after the prolonged rainfall period, growth in international markets including South Africa, and the movement in other expenses that contributed to operating-margin pressure. The supplied results data does not disclose a formal future target or scheduled operational milestone.