










Vibhor Q2 revenue rises 27%, but profit margins trail FY24
Key highlights
- Vibhor reported Q2FY27 revenue of Rs 357.81 crore, up 27% from Rs 281.76 crore in Q2FY26.
- Q2FY27 EBITDA rose 50.16% year on year to Rs 14.13 crore, while EBITDA margin increased to 3.95% from 3.34%.
- H1FY27 revenue reached Rs 651.49 crore and EBITDA was Rs 26.50 crore, up 27.07% and 34.72% year on year.
- FY26 PAT margin was 0.77%, below 1.18% in FY25 and 1.65% in FY24.
powered by IRIS
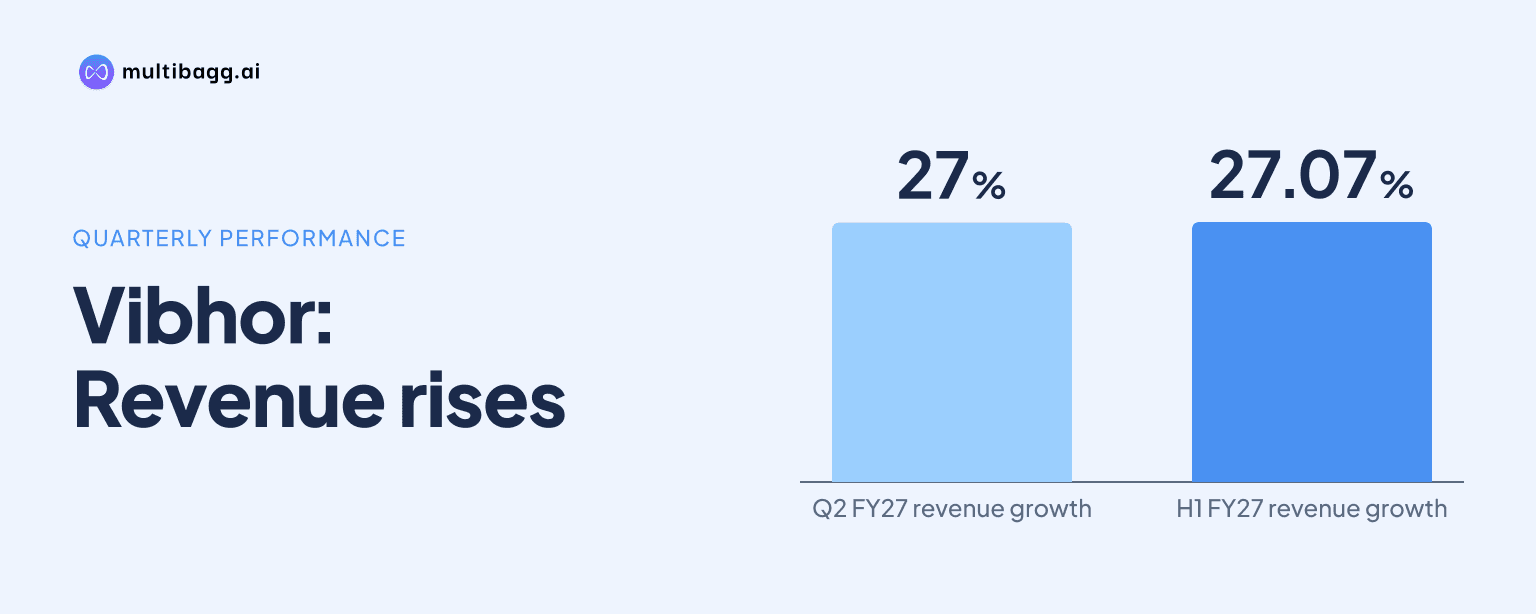
Vibhor Steel Tubes Limited reported Q2FY27 revenue of Rs 357.81 crore, up 27% year on year, while EBITDA rose 50.16% to Rs 14.13 crore; however, its 0.76% profit after tax margin remained below the 1.65% reported in FY24. The quarter showed higher operating profit and revenue, but not a return to FY24 profitability levels.
Know Vibhor Steel Tubes inside out
Results, valuation, peers and who's buying, in one view.
How did Vibhor perform in Q2FY27?
Vibhor reported revenue of Rs 357.81 crore in Q2FY27, compared with Rs 281.76 crore in Q2FY26 and Rs 293.69 crore in Q1FY27. The company attributed the 27% year-on-year increase to capacity addition and strong demand. Revenue was also Rs 64.12 crore above the Q1FY27 level.
Earnings before interest, tax, depreciation and amortisation, or EBITDA, rose 50.16% year on year to Rs 14.13 crore from Rs 9.41 crore. Profit after tax, or PAT, was Rs 2.72 crore, compared with Rs 1.42 crore in Q2FY26 and Rs 1.93 crore in Q1FY27, showing improvement on both comparisons.
Vibhor’s EBITDA margin was 3.95% in Q2FY27, up from 3.34% in Q2FY26 but below 4.21% in Q1FY27. PAT margin increased to 0.76% from 0.50% a year earlier and 0.66% in Q1FY27. The company said operational efficiencies and raw-material and logistics advantages, particularly at its Odisha plant, supported the year-on-year EBITDA-margin expansion.
Did Vibhor sustain growth in H1FY27?
Vibhor generated revenue of Rs 651.49 crore in H1FY27, up 27.07% from Rs 512.72 crore in H1FY26. The H1FY27 total also exceeded Rs 636.63 crore reported in H2FY26, although the two periods represent different halves of consecutive financial years.
EBITDA increased 34.72% year on year to Rs 26.50 crore in H1FY27 from Rs 19.67 crore in H1FY26. PAT was Rs 4.65 crore, marginally above Rs 4.56 crore in H1FY26 and Rs 4.20 crore in H2FY26. EBITDA increased by Rs 6.83 crore year on year, whereas PAT rose by Rs 0.09 crore.
H1FY27 EBITDA margin was 4.07%, compared with 3.84% in H1FY26 and 4.20% in H2FY26. PAT margin was 0.71%, versus 0.89% in H1FY26 and 0.66% in H2FY26. Management attributed the year-on-year PAT-margin outcome to increased higher-value-added products, although the reported margin remained below the H1FY26 level.
How do Vibhor’s margins compare with FY24?
Vibhor’s FY26 EBITDA margin of 4.04% was below 4.70% in FY24, despite recovering from 3.86% in FY25. PAT margin declined across the three reported years, from 1.65% in FY24 to 1.18% in FY25 and 0.77% in FY26. Q2FY27 margins of 3.95% for EBITDA and 0.76% for PAT also remained below the FY24 annual levels.
Revenue declined from Rs 1,072.71 crore in FY24 to Rs 996.38 crore in FY25, then increased to Rs 1,149.35 crore in FY26. EBITDA followed a similar path, falling from Rs 50.46 crore to Rs 38.48 crore before recovering to Rs 46.40 crore. PAT moved differently, declining from Rs 17.72 crore in FY24 to Rs 11.77 crore in FY25 and Rs 8.79 crore in FY26.
Earnings per share declined from Rs 9.34 in FY24 to Rs 6.21 in FY25 and Rs 4.64 in FY26. Return on equity, or ROE, fell from 9.97% to 6.26% and 4.46%, while return on capital employed, or ROCE, moved from 21.08% to 11.85% and 11.80%. Debt-to-equity rose from 0.79 times in FY24 to 0.97 times in FY26.
Got a follow-up? Ask IRIS
What is Vibhor planning for its product mix?
Vibhor plans to change its product mix from 90:10, comprising 90% galvanised iron, or GI, pipes and 10% other products, to 75:25 by FY28. Management said the shift is intended to increase diversification and higher-value product contribution. It identifies crash barriers, hexagonal poles and transmission line towers as margin-accretive segments.
In Q2FY27, Vibhor incorporated Viom Steel Infra Pvt Ltd as a wholly owned subsidiary to manufacture transmission towers, monopoles, crash barriers, octagonal poles and high-mast poles. The company also said it plans to enter swaged poles and has ordered machinery for the product. Its existing portfolio includes electric resistance welded pipes, hot-dipped galvanised pipes, hollow sections and primer-painted pipes.
Vibhor said exports contribute 3% to 5% of revenue and management has set a roadmap to scale exports tenfold over the next five years. The company reported three manufacturing units in Maharashtra, Telangana and Odisha, with installed capacity of 3,77,000 metric tonnes per annum, alongside one warehouse in Haryana and export presence in three countries in H1FY27.
What financing and cost factors did Vibhor disclose?
Vibhor said CRISIL Ratings recently assigned a BBB+/Stable long-term rating and a CRISIL A2 short-term rating to bank loan facilities aggregating to Rs 370 crore. The presentation did not provide a date for the rating action or a facility-level breakdown. Its disclosed FY26 debt-to-equity ratio was 0.97 times.
The company cited cost control across units, operational efficiencies and Odisha-based raw-material and logistics advantages as Q2FY27 margin factors. These were reported alongside EBITDA margin increasing to 3.95% from 3.34% in Q2FY26. The presentation does not state whether these cost factors will continue in subsequent quarters.
Conclusion
Vibhor’s Q2FY27 and H1FY27 results show higher revenue, EBITDA and PAT than the comparable prior-year periods, with Q2 revenue reaching Rs 357.81 crore and H1 EBITDA reaching Rs 26.50 crore. The longer comparison remains different: FY26 revenue exceeded FY24, but FY26 PAT of Rs 8.79 crore, PAT margin of 0.77%, ROE of 4.46% and ROCE of 11.80% were below FY24 levels.
The next disclosed markers are management’s FY28 product-mix target of 75:25 from 90:10, the planned swaged-poles entry following machinery orders, and the five-year export roadmap from a 3% to 5% revenue contribution. Results will also show whether Q2FY27 EBITDA margin of 3.95% moves towards the FY24 level of 4.70% as the stated efficiency and product initiatives progress.