










Virtual Galaxy EBITDA margin reaches 51.7% in H1 FY2027
Key highlights
- Virtual Galaxy reported H1 FY2027 revenue of Rs 104.60 crore, up 21% year-on-year.
- Virtual Galaxy’s H1 FY2027 EBITDA margin expanded 704 basis points to 51.7%.
- Virtual Galaxy’s H1 FY2027 PAT rose 12% to Rs 24.60 crore while EBITDA increased 41%.
- Virtual Galaxy held Rs 148.90 crore of unexecuted orders at the end of H1 FY2027, up 46% year-on-year.
powered by IRIS
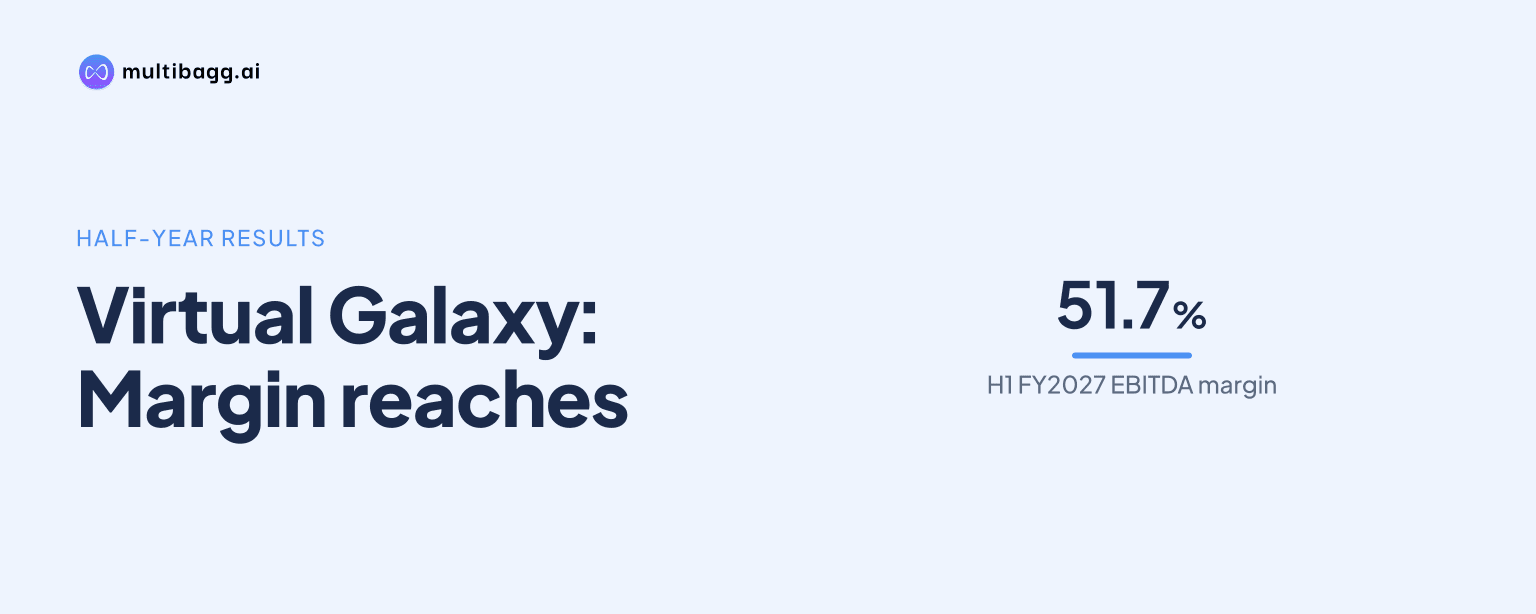
Virtual Galaxy Infotech Limited raised its EBITDA margin to 51.7% in H1 FY2027 from 44.6% a year earlier as revenue grew 21% and combined material-consumption and software-development costs rose only 4%. Virtual Galaxy’s profit after tax, or PAT, increased 12% to Rs 24.60 crore, held back by higher depreciation and finance costs.
Know Virtual Galaxy Infotech inside out
Results, valuation, peers and who's buying, in one view.
How did Virtual Galaxy’s H1 FY2027 profitability change?
Virtual Galaxy reported revenue from operations of Rs 104.60 crore in H1 FY2027, up 21% from Rs 86.10 crore in H1 FY2026, while earnings before interest, tax, depreciation and amortisation, or EBITDA, rose 41% to Rs 54 crore from Rs 38.40 crore. The difference in growth rates lifted EBITDA margin by 704 basis points to 51.7% from 44.6%.
Virtual Galaxy’s PAT rose to Rs 24.60 crore in H1 FY2027 from Rs 22 crore in the corresponding period, a 12% increase that lagged EBITDA growth. PAT margin was 23.6%, indicating that the Rs 15.60 crore increase in EBITDA was not matched by an equivalent increase in profit after depreciation, finance costs and tax.
What drove Virtual Galaxy’s EBITDA-margin expansion?
Virtual Galaxy attributed the H1 FY2027 margin expansion to operating expenditure growing more slowly than revenue. Combined spending on material consumption and software development rose 4% to Rs 35.20 crore, compared with 21% revenue growth, while employee-benefit expenses increased 14% and other expenses rose 9%.
Virtual Galaxy’s reported revenue growth was moderated by lower non-core hardware and related sales, which fell to Rs 1 crore in H1 FY2027 from Rs 7.90 crore a year earlier. Excluding these sales, management said core revenue comprising annual software-as-a-service, or SaaS, revenue and software sales grew 32% to Rs 103.60 crore.
Product-sales revenue rose 33% to Rs 55.60 crore in H1 FY2027, while SaaS-services revenue increased 32% to Rs 47.90 crore from Rs 36.40 crore. Both segments grew faster than overall revenue, and management said the contribution from recurring SaaS revenue and operating leverage supports EBITDA margins of around 50%, which is management’s view rather than formal guidance.
Why did Virtual Galaxy’s PAT lag EBITDA growth?
Virtual Galaxy said higher depreciation and finance costs moderated the conversion of EBITDA into PAT during H1 FY2027. In the conference call, management cited depreciation of Rs 17.62 crore against Rs 6.60 crore in H1 FY2026 and said finance cost had increased to Rs 1.70 crore.
Virtual Galaxy’s tangible assets under development increased to Rs 57.90 crore on September 30, 2026, from Rs 9.80 crore at the end of FY2026. Management said the increase primarily related to build-operate-transfer, or BOT, projects for banks that require upfront investment in servers, data-centre infrastructure and other information-technology hardware.
Virtual Galaxy said commissioned BOT expenditure will be transferred from capital work in progress to fixed assets, after which depreciation will be charged. The company also said such projects are intended to generate monthly rental revenue over contractual tenures of five or seven years, linking the increase in depreciation to assets being deployed for recurring revenue.
Got a follow-up? Ask IRIS
Why did Virtual Galaxy’s Q2 EBITDA margin decline from Q1?
Virtual Galaxy’s EBITDA margin declined sequentially to 49.0% in Q2 FY2027 from 55.9% in Q1 FY2027, despite revenue rising 59% to Rs 64.20 crore from Rs 40.40 crore. EBITDA nevertheless increased 39% to Rs 31.50 crore from Rs 22.60 crore, so the percentage-margin decline did not reduce absolute operating profit.
Virtual Galaxy’s management attributed the Q2 margin movement to higher material consumption, including servers, storage, related hardware and data-centre items. In response to an analyst question, management cited material-consumption figures rising from Rs 24.95 crore to Rs 35.21 crore and described the margin effect as a lag of about 2%.
Virtual Galaxy also clarified that BOT infrastructure is initially carried as work in progress until projects are completed and operational, rather than being treated as material cost. Q2 PAT increased 68% sequentially to Rs 15.40 crore from Rs 9.20 crore, while management’s explanation for the EBITDA-margin change focused on material consumption rather than depreciation and finance costs, which sit below EBITDA.
What do Virtual Galaxy’s investments and outlook indicate?
Virtual Galaxy generated Rs 38.70 crore of operating cash flow in H1 FY2027 but used Rs 56.90 crore in investing activities and Rs 1.50 crore in financing activities. Cash and cash equivalents fell to Rs 11.40 crore on September 30, 2026, from Rs 31.20 crore on March 31, 2026, while borrowings were broadly stable at Rs 47.90 crore versus Rs 48.40 crore at FY2026-end.
Virtual Galaxy’s intangible assets under development rose to Rs 22.40 crore from Rs 12.40 crore at FY2026-end, primarily reflecting research and development spending on proprietary software platforms. Management expects these investments to support incremental SaaS revenue from H2 FY2027, subject to approvals, certifications and implementation requirements.
Virtual Galaxy retained its FY2027 revenue-growth guidance of 40% and said roughly 60% of annual revenue is typically generated in H2. Its unexecuted order book stood at Rs 148.90 crore at the end of H1 FY2027, up 46% from Rs 102 crore a year earlier, alongside an active bid pipeline of approximately Rs 1,000 crore.
Conclusion
Virtual Galaxy’s H1 FY2027 performance showed operating leverage, with EBITDA increasing 41% against 21% revenue growth and margin reaching 51.7%. However, PAT grew 12%, reflecting management’s disclosure of higher depreciation and finance costs as investments in banking infrastructure and software development increased.
The next measures to watch are the commissioning of BOT projects from March 2027 onwards, the start of associated monthly rental revenue, and conversion of the Rs 148.90 crore order book into implementation and reported revenue. Management’s unchanged 40% FY2027 revenue-growth guidance depends heavily on H2, which it says normally contributes about 60% of annual revenue.