










Virtual Galaxy reported Rs 56.9 crore H1 FY27 investing outflow
Key highlights
- Virtual Galaxy used Rs 56.9 crore of cash in investing activities in H1 FY27.
- Tangible and intangible assets including CWIP totalled Rs 242.9 crore in H1 FY27.
- H1 FY27 operating cash flow was Rs 38.7 crore, versus Rs 56.9 crore of investing outflow.
- H1 FY27 revenue rose 21% to Rs 104.6 crore and EBITDA rose 41% to Rs 54.0 crore.
powered by IRIS
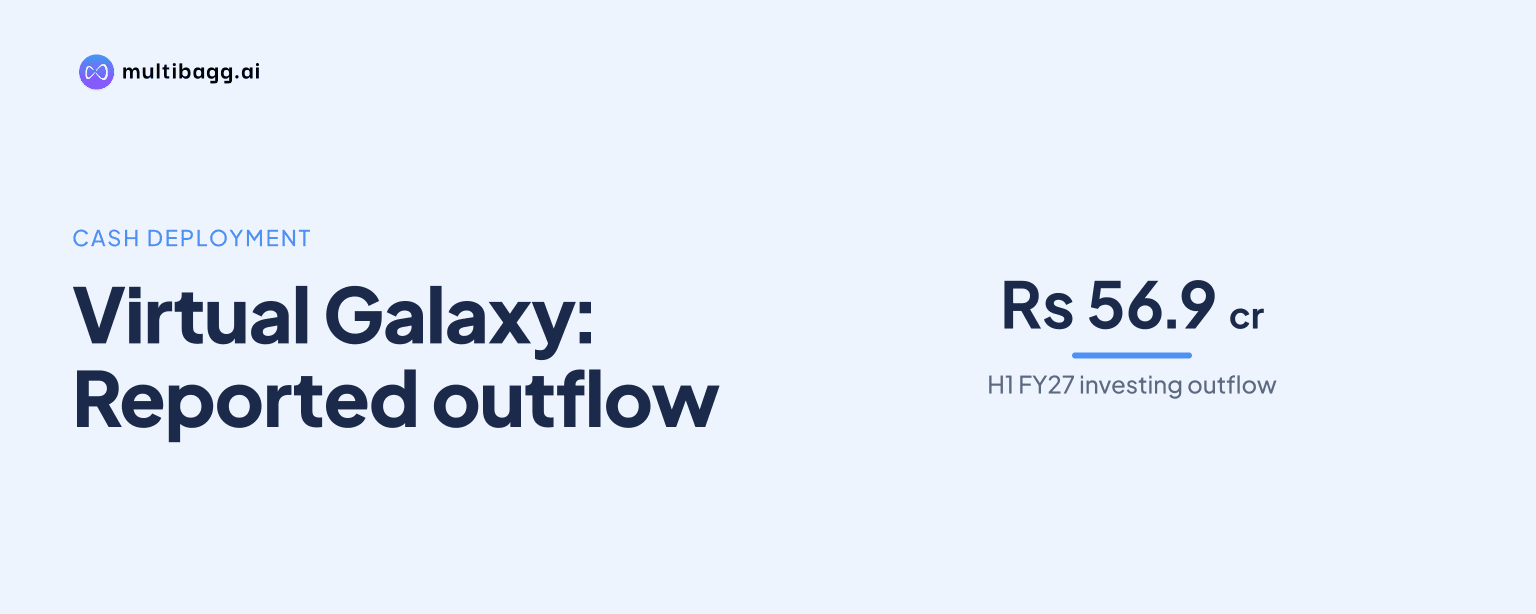
Virtual Galaxy Infotech Limited reported Rs 56.9 crore of cash used in investing activities in H1 FY27, while tangible and intangible assets, including capital work in progress, totalled Rs 242.9 crore at period-end; the presentation neither identifies bank build-operate-transfer infrastructure nor gives a March 2027 rental-income start date.
Know Virtual Galaxy Infotech inside out
Results, valuation, peers and who's buying, in one view.
What drove Virtual Galaxy's H1 FY27 investment outflow?
Virtual Galaxy reported Rs 56.9 crore of cash used in investing activities in H1 FY27, following Rs 105.6 crore in FY26, Rs 51.3 crore in FY25 and Rs 31.1 crore in FY24. The cash-flow statement presents this as a consolidated investing-activities line and does not provide an asset-by-asset breakdown. It therefore establishes a material cash outflow for investment, but not the specific project, customer, contract structure or expected income stream behind it.
The presentation does not state that any part of the Rs 56.9 crore outflow was invested in bank build-operate-transfer, or BOT, infrastructure. It also does not identify March 2027 as a rental-income start date. Those details cannot be inferred from the balance sheet because Virtual Galaxy reports tangible assets, intangible assets and capital work in progress, or CWIP, in aggregate rather than by project or commercial model.
Cash used in investing activities was greater than the Rs 38.7 crore generated from operating activities in H1 FY27, creating a difference of Rs 18.2 crore before financing flows. Cash from financing activities was negative Rs 1.6 crore in the half year, and cash and cash equivalents declined from Rs 31.2 crore at the start of H1 FY27 to Rs 11.4 crore at the end. The presentation thus shows that investment spending coincided with lower reported cash balances during the period.
How much has Virtual Galaxy's asset base expanded?
Virtual Galaxy's non-current assets increased to Rs 247.5 crore in H1 FY27 from Rs 208.5 crore at FY26-end, led by tangible assets including CWIP. Tangible assets rose Rs 34.2 crore over the half year to Rs 185.8 crore, while intangible assets including CWIP increased Rs 6.4 crore to Rs 57.1 crore. Together, these two categories reached Rs 242.9 crore, equivalent to nearly all reported non-current assets.
The expansion predates H1 FY27. Tangible assets including CWIP rose by Rs 65.6 crore in FY26 from FY25, while intangible assets including CWIP grew by Rs 20.2 crore. In H1 FY27, the Rs 34.2 crore increase in tangible assets was more than five times the Rs 6.4 crore increase in intangible assets, indicating that the reported half-year asset addition was concentrated in the tangible-assets category rather than software-related intangible assets.
Total assets were Rs 322.0 crore in H1 FY27, compared with Rs 299.1 crore at FY26-end and Rs 158.2 crore at FY25-end. Current assets fell to Rs 74.5 crore from Rs 90.6 crore over the H1 FY27 period, partly reflecting the reduction in cash and cash equivalents to Rs 11.4 crore. This contrasts with the Rs 39.0 crore rise in non-current assets, shifting the reported asset mix further toward longer-duration assets.
Got a follow-up? Ask IRIS
Did Virtual Galaxy's operating cash flow cover the build-out?
Virtual Galaxy's H1 FY27 operating cash generation of Rs 38.7 crore did not fully cover the reported Rs 56.9 crore investing outflow. The difference means operating cash flow alone was Rs 18.2 crore below investing cash use in the half year. This is a cash-flow comparison, not evidence that any particular asset category was funded by a specific source of cash.
Cash from operating activities nevertheless increased from Rs 30.8 crore in FY24 to Rs 43.2 crore in FY25 and Rs 49.4 crore in FY26. For H1 FY27, the Rs 38.7 crore operating cash figure was 78% of the FY26 full-year amount. The presentation also shows trade receivables of Rs 42.5 crore at H1 FY27, up from Rs 32.2 crore at FY26-end, while short-term loans and advances declined to Rs 14.4 crore from Rs 21.4 crore.
Financing cash flows changed materially across the reported periods. Cash from financing activities was Rs 84.9 crore in FY26 after Rs 8.5 crore in FY25, then turned negative at Rs 1.6 crore in H1 FY27. Long-term borrowings increased to Rs 40.3 crore in H1 FY27 from Rs 35.9 crore in FY26, whereas short-term borrowings fell to Rs 7.6 crore from Rs 12.5 crore. Total shareholders' equity reached Rs 248.0 crore, compared with Rs 218.5 crore at FY26-end.
What did H1 FY27 profitability and operating metrics show?
Virtual Galaxy reported H1 FY27 revenue of Rs 104.6 crore, up 21% from Rs 86.1 crore in H1 FY26, while earnings before interest, tax, depreciation and amortisation, or EBITDA, rose 41% to Rs 54.0 crore. EBITDA margin increased to 51.7% from 44.6%, a gain of 704 basis points, where one basis point equals one hundredth of a percentage point. This higher operating profit was reported alongside the investment outflow and asset growth.
Profit after tax, or PAT, rose 12% to Rs 24.6 crore in H1 FY27 from Rs 22.0 crore a year earlier, but PAT margin declined to 23.6% from 25.6%. Depreciation and amortisation expense increased 165% to Rs 17.6 crore, compared with Rs 6.7 crore in H1 FY26. Finance cost also increased 55% to Rs 1.7 crore, and these two costs help explain why PAT growth was below EBITDA growth.
For the full-year comparison, revenue increased 52% to Rs 182.1 crore in FY26 from Rs 120.1 crore in FY25, and EBITDA rose 52% to Rs 84.2 crore. By contrast, EBITDA margin was broadly stable at 46.2% in FY26 versus 46.0% in FY25. Debtor days declined from 72 in FY25 to 55 in FY26, while the cash conversion cycle moved to 19 days from 13 days, showing that the presentation's working-capital measures did not move uniformly.
Conclusion
Virtual Galaxy's disclosed figures support a conclusion of substantial investment-related cash use and continuing asset accumulation: Rs 56.9 crore of investing cash outflow in H1 FY27 accompanied Rs 247.5 crore of non-current assets. They do not support the more specific claim of a Rs 57.9 crore bank BOT project or rental income commencing in March 2027, because neither item appears in the supplied presentation.
The next disclosed items to watch are Virtual Galaxy's plan to develop a 10-acre integrated technology campus at Mihan Special Economic Zone and expand implementation and cloud-delivery infrastructure. Management also cites a Rs 1,000 crore bid pipeline with a 20% historical win ratio and aims to maintain 40% recurring revenue and 25% PAT margins, but the presentation provides no schedule linking those plans to a particular rental-income date.