










VRL Logistics Limited Breakout Holds Near 52-Week High After Rally
Key highlights
- VRL Logistics closed at Rs 339.05 on November 6, up 8.47% from the previous close.
- VRL Logistics gained 30.45% over one week and 18.92% over one month in the reported market data.
- VRL Logistics was reported above its 5-day, 20-day, 50-day, 100-day and 200-day moving averages.
- VRL Logistics reported Q1 FY27 revenue of Rs 885 crore, up 17.84% year-on-year, and quarterly profit of Rs 81 crore.
powered by IRIS
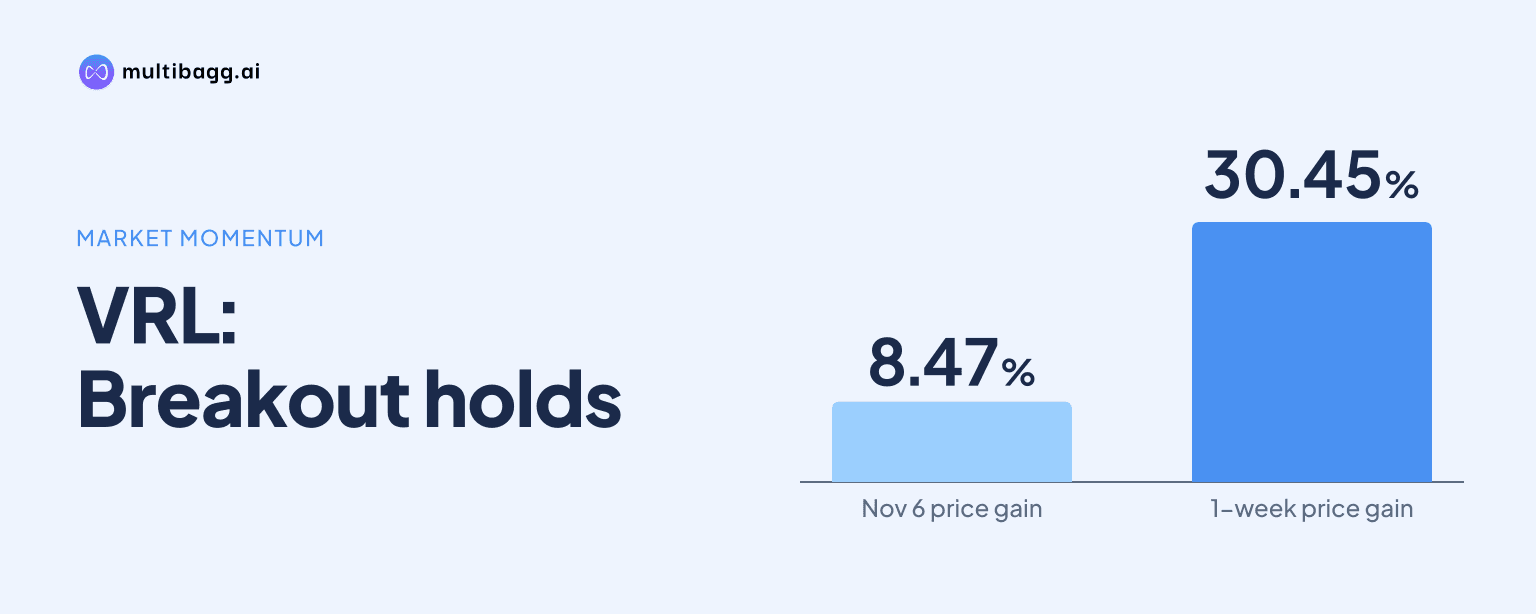
VRL Logistics Limited ended November 6 at Rs 339.05, up 8.47% from the previous close, after a 30.45% one-week rally that carried the stock close to its 52-week high. The move followed reports of sharply improved quarterly profit and placed VRL Logistics above its major moving averages, although some weekly indicators remained cautious.
Why did VRL Logistics shares rally?
VRL Logistics shares rallied after the market responded to stronger quarterly performance and sustained buying interest. A November 3 report said the stock jumped 14% to a 52-week high after Q2 profit more than doubled, while brokerages were described as bullish. Separately, social-media commentary linked the latest advance to a period of consolidation followed by higher volumes.
The price action remained strong through November 6. One market snapshot put the closing price at Rs 339.05, up 8.47% from Rs 312.60, while another intraday update showed the stock at Rs 330.10 at 1:25 pm. These timestamps show that the share moved sharply during the session, rather than following a steady intraday path.
Is VRL Logistics above its consolidation range?
VRL Logistics appears to have moved above the range discussed by traders, with the November 3 session cited as a key breakout point. One update recorded a move from Rs 278.80 to Rs 306.65 by 10:05 am, with an intraday band of Rs 291.10 to Rs 319.20. Commentary described a sustained move above that range, supported by unusual turnover, as a continuation rather than a rebound from a steep fall.
The November 6 close of Rs 339.05 reinforced that view, though it also brought the stock nearer to a resistance area defined by its annual peak. Market data cited a 52-week high of Rs 347.70 in one update and Rs 348 in another. A price close to a yearly high can indicate continued demand, but it also means that short-term price swings can increase if buyers do not sustain the move.
What technical signals support the VRL Logistics breakout?
VRL Logistics was reported to be trading above its 5-day, 20-day, 50-day, 100-day and 200-day moving averages, which is the clearest technical support cited for the breakout view. The updates also noted that the stock had moved above its 50-day moving average, a level often tracked by momentum-focused market participants.
Volume-based readings were also constructive in the supplied discussion. Weekly and monthly On-Balance Volume readings were described as bullish, while Bollinger Bands were said to be expanding, indicating higher volatility alongside the advance. The reports did not establish a price target from these indicators, but they presented the combination as evidence that buying interest had accompanied the price move.
Got a follow-up? Ask IRIS
What could interrupt VRL Logistics momentum?
VRL Logistics could face short-term consolidation or profit-taking because the weekly signals were not uniformly positive. The supplied technical commentary cited a mild bearish bias in weekly MACD and RSI in one assessment, while another referred to mild bearish RSI divergence. Mixed weekly KST readings were also flagged against a more constructive monthly picture.
Traders following the reported breakout levels have focused on Rs 291.10 as a reference point from the November 3 session and Rs 319.20 as the session high that defined the initial range. One update said a return below Rs 291.10 would put the stock back inside its earlier range, while fading turnover towards the cited 20-day average of 174,812 shares could weaken momentum. These are technical reference points, not guarantees of future trading outcomes.
How do the reported business numbers compare with the share move?
VRL Logistics' reported operating performance provides the fundamental backdrop cited alongside the price rise. The company was described as delivering its highest-ever quarterly profit of Rs 81 crore in Q1 FY27, with revenue rising 17.84% year-on-year to Rs 885 crore and EBITDA margin expanding to 21.8%. Freight-rate increases to pass through higher fuel costs and 8.98% volume growth were cited as contributors.
Other updates gave a later quarterly snapshot of net sales at a record Rs 961.92 crore and said net profit rose 27.87% in the September 2026 quarter. The available posts do not provide a full, reconciled set of financial statements, so investors should distinguish between the reported quarterly figures and technical commentary circulated on social platforms. The context also noted average net-sales growth of 9.72% annually over five years, which is slower than the recent quarterly growth rates.
Conclusion
The available market updates point to a momentum-driven move in VRL Logistics, supported by a 30.45% weekly gain, a closing price of Rs 339.05 on November 6 and a position above the major moving averages. Improved reported profitability and revenue growth strengthened the narrative behind the rally, while the stock's proximity to its 52-week high kept the breakout in focus.
The next issue to watch is whether VRL Logistics can sustain trading near the reported Rs 347.70 to Rs 348 annual-high zone without slipping back into the earlier range. Investors will also watch follow-through in trading volumes, the impact of branch-network expansion and working-capital management, and any further information on the announced buyback.