










AAL working-capital days rise to 75 as RoCE falls to 20%
Key highlights
- AAL’s working-capital days rose to 75 in FY26 from 40 in FY25.
- AAL’s RoCE declined to 20% in FY26 from 28% in FY25.
- FY26 sales increased to Rs 637.78 crore and PAT rose to Rs 35.28 crore.
- H1FY27 total assets reached Rs 746.94 crore and borrowings reached Rs 109.77 crore.
powered by IRIS
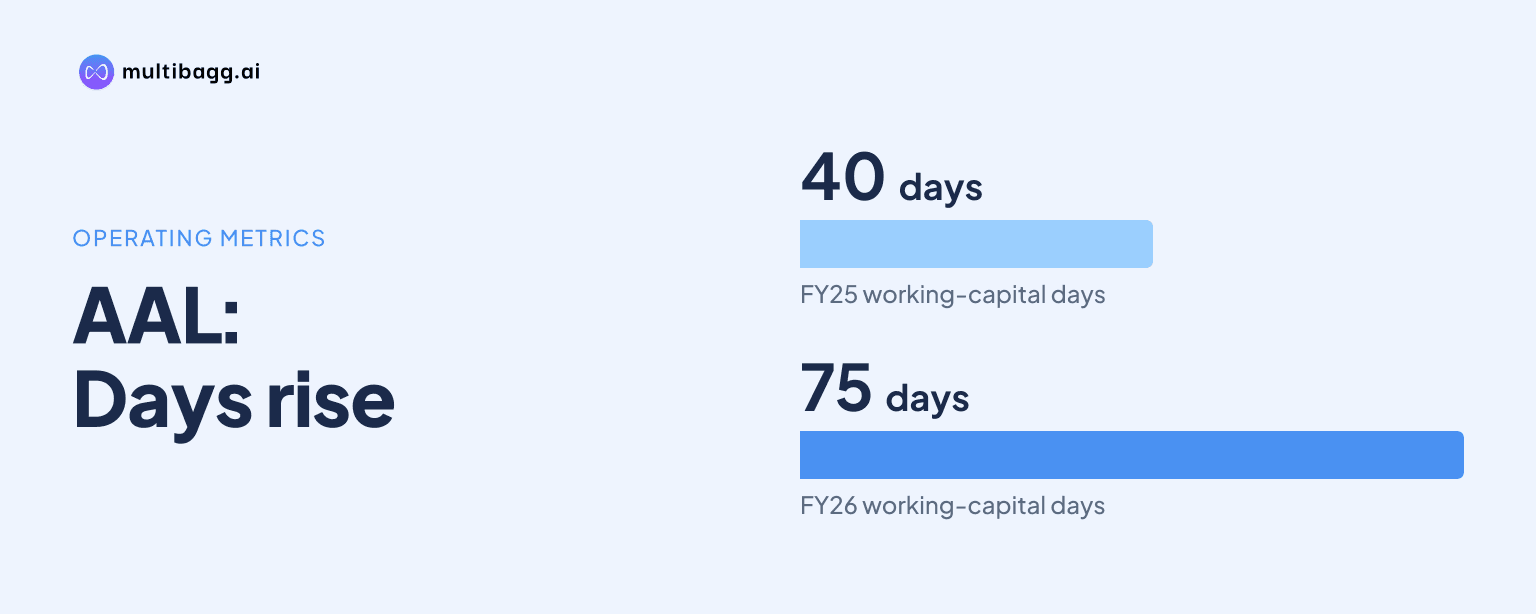
Advance Agrolife Limited reported working-capital days of 75 in FY26, up from 40 in FY25, while return on capital employed, or RoCE, fell to 20% from 28%. The change came as FY26 sales increased to Rs 637.78 crore from Rs 502.26 crore and total assets expanded to Rs 624.99 crore from Rs 351.47 crore.
Know Advance Agrolife inside out
Results, valuation, peers and who's buying, in one view.
Why did AAL’s working-capital days rise to 75 in FY26?
AAL’s reported working-capital days increased by 35 days to 75 in FY26 from 40 in FY25, after rising from 32 days in FY24. The presentation does not disclose the formula for the measure or separate inventory, receivables and payables figures, so it does not identify the specific driver of the increase.
The balance sheet shows other assets rose to Rs 521.73 crore at FY26 from Rs 276.20 crore at FY25, an increase of Rs 245.53 crore. Over the same period, sales rose by Rs 135.52 crore to Rs 637.78 crore, while total assets increased by Rs 273.52 crore to Rs 624.99 crore.
Capital work in progress, or CWIP, increased to Rs 22.22 crore in FY26 from Rs 10.55 crore in FY25, and fixed assets rose to Rs 81.04 crore from Rs 64.72 crore. These additions expanded the asset base, although AAL does not classify CWIP or fixed assets as working capital or directly link them to the 75-day measure.
How did AAL’s return on capital employed change?
AAL’s RoCE declined to 20% in FY26 from 28% in FY25, 38% in FY24 and 35% in FY23. The FY26 figure was 18 percentage points below FY24, despite FY26 recording the highest sales, earnings before interest, tax, depreciation and amortisation, or EBITDA, and profit after tax, or PAT, in the four-year series.
EBITDA increased to Rs 63.69 crore in FY26 from Rs 47.63 crore in FY25, while the reported EBITDA margin rose to 10% from 9%. PAT increased to Rs 35.28 crore from Rs 25.64 crore, but this earnings growth coincided with total assets increasing to Rs 624.99 crore from Rs 351.47 crore.
AAL reports the RoCE percentages without disclosing the calculation methodology, average capital employed or profit measure used in the ratio. The presentation therefore documents the decline from 28% to 20%, but does not provide a bridge separating the effects of earnings, debt, equity and asset additions.
How did AAL fund the FY26 balance-sheet expansion?
AAL reported borrowings of Rs 96.06 crore at FY26, compared with Rs 79.24 crore at FY25, while other liabilities increased to Rs 219.00 crore from Rs 171.36 crore. Total liabilities and equity rose by Rs 273.52 crore to Rs 624.99 crore, equal to the increase in total assets.
Equity capital increased to Rs 64.29 crore in FY26 from Rs 45.00 crore in FY25, and reserves rose to Rs 245.63 crore from Rs 55.87 crore. AAL’s reported debt-to-equity ratio declined to 0.3 in FY26 from 0.8 in FY25, even as borrowings increased by Rs 16.82 crore, alongside the larger equity base.
At H1FY27, AAL reported borrowings of Rs 109.77 crore, CWIP of Rs 34.52 crore and other assets of Rs 624.95 crore. Total assets reached Rs 746.94 crore at H1FY27, compared with Rs 624.99 crore at FY26, showing that all three balance-sheet items remained above their FY26 levels.
Got a follow-up? Ask IRIS
Did AAL’s H1FY27 earnings grow as its assets increased?
AAL’s H1FY27 sales rose 62% year on year to Rs 617.56 crore from Rs 381.26 crore, while PAT increased 38% to Rs 34.34 crore from Rs 24.81 crore. EBITDA rose 33% to Rs 56.90 crore, but EBITDA margin declined to 9.2% from 11.3% in H1FY26.
The second quarter was below the first quarter on reported revenue and profitability. Q2FY27 revenue was Rs 287.15 crore, 35% above Q2FY26 but 13% below Rs 330.40 crore in Q1FY27; Q2FY27 EBITDA was Rs 21.83 crore, down 15% year on year and 38% quarter on quarter.
Finance cost was Rs 5.07 crore in H1FY27, 19% above Rs 4.27 crore in H1FY26. AAL does not provide working-capital days or RoCE for H1FY27, so the presentation does not show whether the higher H1FY27 asset base changed either FY26 capital-efficiency measure.
What could affect AAL’s capital efficiency next?
Management expects the Gidhani plant to be commissioned by the end of Q4 and says it should enhance manufacturing capability and production capacity, support future business growth and facilitate product diversification. The presentation does not disclose the project’s cost, expected revenue contribution or a RoCE target linked to the plant.
AAL also reported more than 500 registrations with the Central Insecticides Board and Registration Committee, or CIB & RC, and management described the portfolio as supporting business continuity, market access and diversification. Its export expansion covered Libya, Myanmar, Oman, Saudi Arabia, Somalia, Tanzania and Afghanistan, while management said investments continue in distribution, exports, registrations and manufacturing infrastructure.
Conclusion
AAL’s FY26 figures show sales and PAT rising to Rs 637.78 crore and Rs 35.28 crore, respectively, alongside a rise in working-capital days to 75 and a decline in RoCE to 20%. The balance sheet expanded sharply, led by other assets of Rs 521.73 crore, while borrowings reached Rs 96.06 crore and CWIP reached Rs 22.22 crore.
The next disclosed annual capital-efficiency figures will show whether the FY26 pattern changes as management pursues distribution, export and manufacturing investments. Investors can also watch for the expected Gidhani plant commissioning by the end of Q4, after H1FY27 total assets reached Rs 746.94 crore and borrowings reached Rs 109.77 crore.