










AIA Engineering Ltd. first-half EBITDA margin falls to 34.5%
Key highlights
- AIA Engineering Ltd.'s first-half EBITDA margin fell to 34.47% from 39.11% a year earlier.
- AIA Engineering Ltd.'s total income from operations increased 9.30% to Rs 2,280.79 crore in F.Y. 2026-27 — HALF YEAR.
- Raw-material consumption rose Rs 95.25 crore and other expenses increased Rs 116.45 crore in the first half.
- AIA Engineering Ltd.'s Mining sales increased 4,173 MT to 78,956 MT, while Others sales declined 1,336 MT.
powered by IRIS
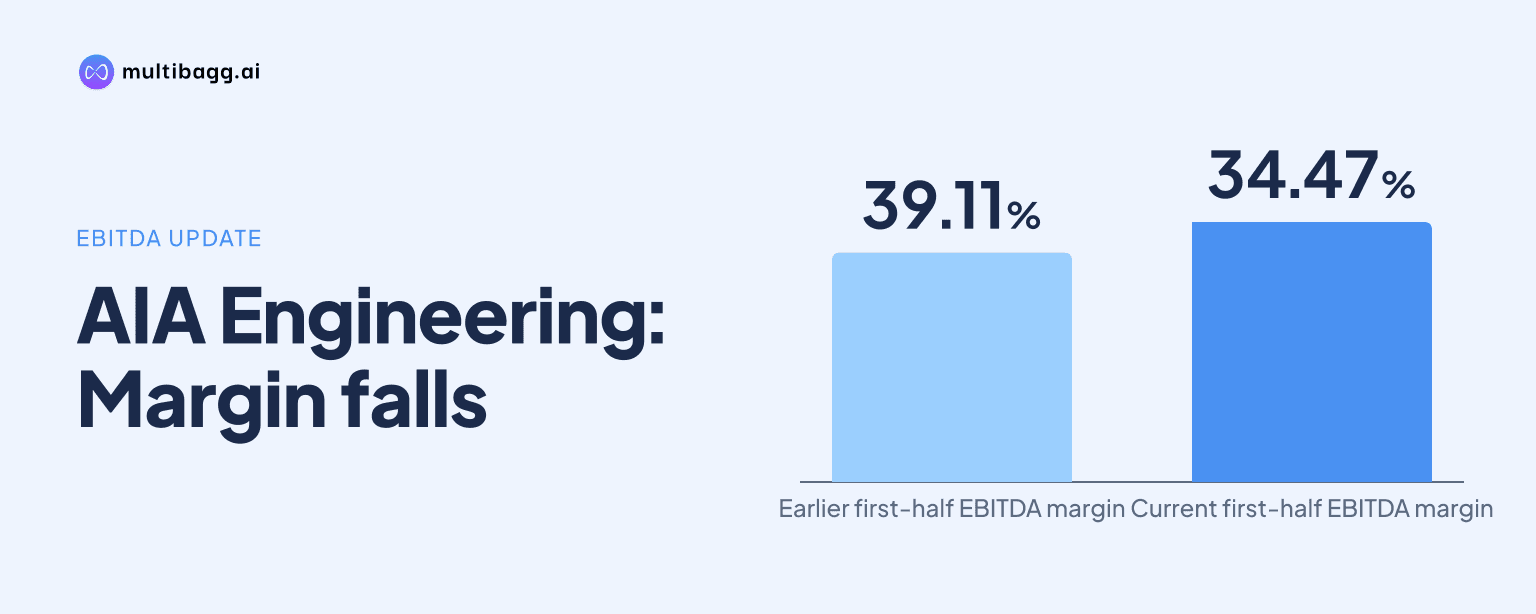
AIA Engineering Limited reported a 34.47% EBITDA margin in F.Y. 2026-27 — HALF YEAR ended September 30, 2026, down from 39.11% a year earlier, even as total income from operations rose 9.30% to Rs 2,280.79 crore; EBITDA fell Rs 29.80 crore to Rs 786.21 crore.
Know AIA Engineering inside out
Results, valuation, peers and who's buying, in one view.
How much did AIA Engineering Ltd.'s operating income grow in the first half?
AIA Engineering Ltd.'s total income from operations increased by Rs 94.08 crore to Rs 2,280.79 crore in F.Y. 2026-27 — HALF YEAR, from Rs 2,086.71 crore in F.Y. 2025-26 — HALF YEAR. Sales rose to Rs 2,246.49 crore from Rs 2,055.69 crore, while other operating income, comprising export benefits and others, increased to Rs 34.30 crore from Rs 31.02 crore.
AIA Engineering Ltd.'s sales volume rose by 2,837 metric tonnes (MT) to 126,152 MT in the first half, although production declined by 3,453 MT to 124,952 MT from 128,405 MT. The presentation does not provide unit realisations, product-level prices or an explanation of the difference between the movement in production and sales volume.
Mining accounted for the reported volume increase. Mining sales increased by 4,173 MT to 78,956 MT from 74,783 MT, while sales in the Others segment declined by 1,336 MT to 47,196 MT from 48,532 MT. The Mining increase exceeded the 2,837-MT increase in total sales because the Others segment recorded a lower volume.
Why did AIA Engineering Ltd.'s EBITDA margin fall?
AIA Engineering Ltd.'s EBITDA margin fell by 4.64 percentage points to 34.47% because several reported expense lines grew faster than total income from operations. Raw-material consumption rose by Rs 95.25 crore to Rs 918.99 crore and other expenses increased by Rs 116.45 crore to Rs 724.92 crore, while operating income increased by Rs 94.08 crore.
Purchases of stock-in-trade declined by Rs 32.33 crore to Rs 13.82 crore, but this reduction did not offset increases elsewhere in the cost base. The change in inventories line was Rs 21.19 crore less negative at negative Rs 69.38 crore, compared with negative Rs 90.57 crore, and employee-benefit expenses increased by Rs 5.78 crore to Rs 101.45 crore.
The figures show that raw materials and other expenses together increased by Rs 211.70 crore, compared with the Rs 94.08 crore rise in operating income. AIA Engineering Ltd.'s share of profit from its joint venture rose to Rs 13.01 crore from Rs 6.10 crore, but EBITDA still declined to Rs 786.21 crore from Rs 816.01 crore. The presentation does not provide a detailed break-up of other expenses or specific reasons for the higher raw-material consumption.
Got a follow-up? Ask IRIS
How did AIA Engineering Ltd.'s second quarter compare with the first quarter?
AIA Engineering Ltd.'s Q2 F.Y. 2026-27 operating performance was lower than Q1, with total income from operations declining by Rs 55.25 crore to Rs 1,112.77 crore from Rs 1,168.02 crore. EBITDA declined by Rs 62.91 crore to Rs 361.65 crore, and the EBITDA margin reduced to 32.50% from 36.35% in Q1.
Sales volume fell by 3,136 MT sequentially to 61,508 MT in Q2 from 64,644 MT in Q1. Production, however, increased by 2,276 MT to 63,614 MT in Q2 from 61,338 MT in Q1, while Q2 sales were also 1,651 MT below the 63,159 MT reported in Q2 F.Y. 2025-26.
The year-on-year Q2 comparison also showed lower profitability despite higher sales value. Q2 sales increased to Rs 1,093.25 crore from Rs 1,029.67 crore, but EBITDA declined to Rs 361.65 crore from Rs 395.62 crore and profit after tax fell to Rs 249.73 crore from Rs 277.44 crore. The Q2 EBITDA margin was 32.50%, compared with 37.76% in the prior-year quarter.
For the first half, profit before tax declined by Rs 20.91 crore to Rs 724.55 crore from Rs 745.46 crore. Other non-operating income decreased by Rs 24.44 crore to Rs 182.21 crore, as foreign-exchange gain declined to Rs 33.05 crore from Rs 53.87 crore; depreciation and amortisation increased to Rs 59.60 crore from Rs 55.65 crore, while finance cost declined to Rs 2.06 crore from Rs 14.90 crore.
What changed in AIA Engineering Ltd.'s working capital and sales mix?
AIA Engineering Ltd.'s reported working-capital days increased across raw materials, work-in-progress and finished goods, and receivables at Q2 F.Y. 2026-27 compared with Q2 F.Y. 2025-26. Raw-material inventory was Rs 225.25 crore and 41 days, against Rs 169.78 crore and 33 days a year earlier, while work-in-progress and finished-goods inventory was Rs 1,014.94 crore and 79 days, against Rs 881.59 crore and 73 days.
Receivables stood at Rs 965.74 crore and 87 days at Q2 F.Y. 2026-27, compared with Rs 793.95 crore and 72 days at Q2 F.Y. 2025-26. Receivables were lower than the Rs 1,113.33 crore and 90 days reported in Q1 F.Y. 2026-27, whereas work-in-progress and finished-goods inventory rose from Rs 942.37 crore and 74 days in Q1.
Mining sales increased to 39,728 MT in Q2 F.Y. 2026-27 from 38,387 MT in Q2 F.Y. 2025-26, while Others sales declined to 21,780 MT from 24,772 MT. Consequently, total Q2 sales of 61,508 MT were below the prior-year quarter's 63,159 MT, despite the Mining segment's 1,341-MT increase.
Conclusion
AIA Engineering Ltd.'s first-half results combine 9.30% growth in operating income with a Rs 29.80 crore EBITDA decline and a 4.64-percentage-point margin reduction. Higher raw-material consumption and other expenses were recorded alongside a shift in sales volumes toward Mining, while the Others segment reported a 1,336-MT first-half decline.
The presentation does not disclose an F.Y. 2026-27 EBITDA-margin target, volume target, expansion plan or scheduled operating event. The unresolved matters to watch in subsequent disclosures are the drivers of the increase in raw-material and other expenses, as well as movements in the Q2 levels of 87 receivable days and 79 days of work-in-progress and finished-goods inventory.