










Alpex Solar H1 FY27 PAT falls 37% as revenue stays flat
Key highlights
- Alpex reported H1 FY27 PAT of Rs 60.06 crore, down from Rs 94.95 crore in H1 FY26.
- H1 FY27 revenue was Rs 885.01 crore versus Rs 903.24 crore a year earlier.
- H1 FY27 EBITDA declined to Rs 130.98 crore from Rs 144.10 crore.
- Alpex’s Kosi facility has 2.2 GW of G12R TOPCon solar-cell capacity.
powered by IRIS
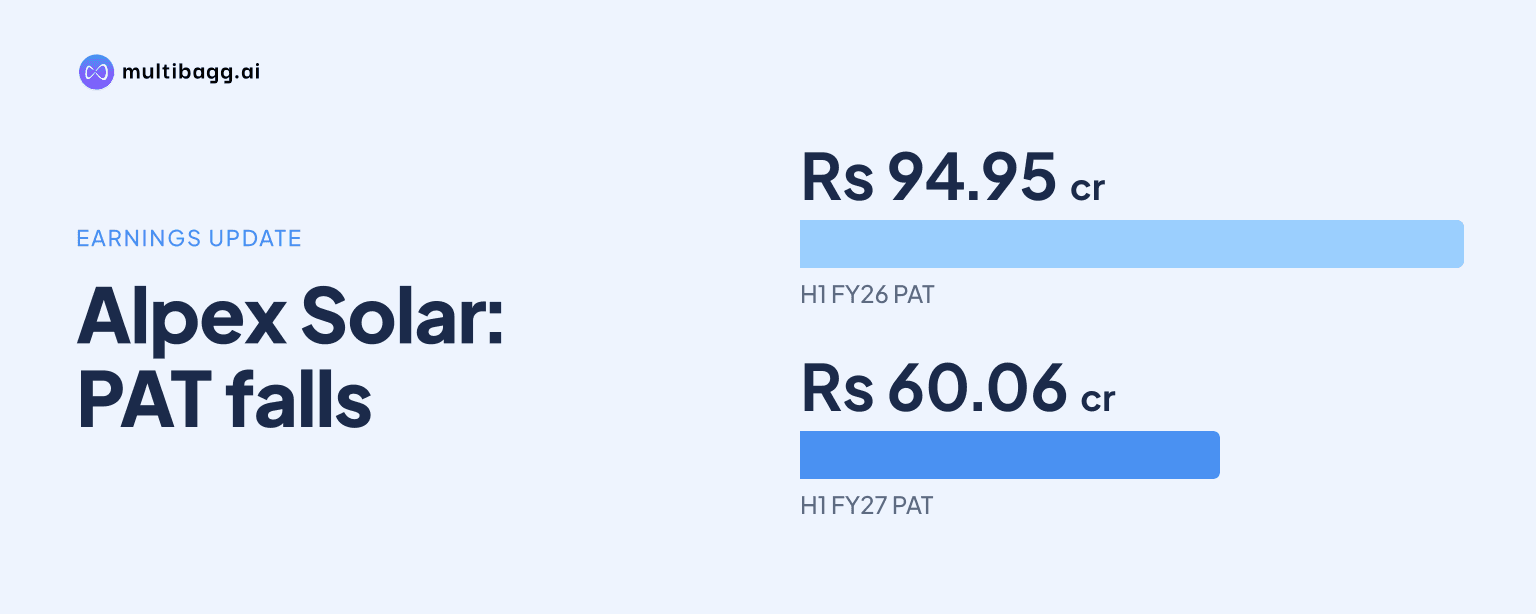
Alpex Solar reported profit after tax (PAT) of Rs 60.06 crore in H1 FY27, down 37% from Rs 94.95 crore in H1 FY26, while revenue was Rs 885.01 crore versus Rs 903.24 crore a year earlier. Earnings before interest, taxes, depreciation and amortisation (EBITDA) also declined to Rs 130.98 crore from Rs 144.10 crore.
Know Alpex Solar inside out
Results, valuation, peers and who's buying, in one view.
How did Alpex perform in H1 FY27?
Alpex recorded revenue of Rs 885.01 crore in H1 FY27, compared with Rs 903.24 crore in H1 FY26, a decline of Rs 18.23 crore, or about 2%. The presentation therefore shows that first-half revenue remained close to the prior-year level rather than expanding year on year.
EBITDA was Rs 130.98 crore in H1 FY27, down Rs 13.12 crore from Rs 144.10 crore in H1 FY26. PAT fell by Rs 34.89 crore to Rs 60.06 crore from Rs 94.95 crore, making the profit reduction larger than the respective changes in revenue and EBITDA.
PAT declined by about 37%, compared with declines of about 9% in EBITDA and 2% in revenue, based on the reported figures. Alpex did not state a specific reason in the supplied presentation for why PAT fell more sharply than revenue or EBITDA during H1 FY27.
What were Alpex’s Q2 FY2026-27 earnings and margins?
Alpex reported second-quarter (Q2) FY2026-27 revenue of Rs 381.59 crore, EBITDA of Rs 53.20 crore and PAT of Rs 20.20 crore. The company reported an EBITDA margin of 13.94% and a PAT margin of 5.29% for the quarter.
The Q2 revenue figure was lower than H1 FY27 revenue of Rs 885.01 crore because the H1 period covers two quarters. The presentation provides Q2 margin data but does not disclose Q1 figures on the supplied pages, limiting a direct quarter-on-quarter comparison of revenue, EBITDA or PAT.
H1 FY27 EBITDA of Rs 130.98 crore represented about 14.80% of revenue of Rs 885.01 crore, based on the reported figures. That calculated first-half ratio is above the 13.94% EBITDA margin reported for Q2, while the source provides no reported H1 FY26 margin for a like-for-like margin comparison.
How does H1 FY27 compare with Alpex’s four-year growth record?
Alpex’s H1 FY27 profit decline follows four financial years of reported annual growth, with revenue from operations rising from Rs 194.68 crore in FY 2022-23 to Rs 2,223.27 crore in FY 2025-26. EBITDA increased from Rs 12.70 crore to Rs 327.39 crore, while PAT rose from Rs 3.74 crore to Rs 201.51 crore over the same four-year period.
The presentation describes the FY 2022-23 to FY 2025-26 movement as 11.44 times revenue growth, 25.78 times EBITDA growth and 53.88 times PAT growth. From FY 2024-25 to FY 2025-26, revenue rose from Rs 780.15 crore to Rs 2,223.27 crore, EBITDA increased from Rs 128.13 crore to Rs 327.39 crore, and PAT rose from Rs 83.48 crore to Rs 201.51 crore.
Annual EBITDA margin increased from 6.52% in FY 2022-23 to 16.42% in FY 2024-25, before declining to 14.73% in FY 2025-26. PAT margin similarly rose from 1.92% to 10.70% before easing to 9.06%, so the H1 FY27 PAT decline follows a period of annual earnings expansion through FY 2025-26.
Got a follow-up? Ask IRIS
What manufacturing projects could affect Alpex’s future margins?
Alpex has commenced production at its 2.2 gigawatt (GW) G12R TOPCon solar-cell facility in Kosi, Mathura, Uttar Pradesh, after installation, commissioning and trial production. The integrated facility spans 9 lakh square feet and has stated cell efficiency of up to 26.5%.
Management says the 2.2 GW cell operation can support backward integration through improved cost control and supply-chain efficiency. Management also says margins are expected to nearly double at both EBITDA and PAT levels following the commencement of cell manufacturing, but that expectation is not a reported H1 FY27 result.
The company’s stated three-year initiative includes phased 5 GW solar-glass manufacturing and phased 5 GW ingot-and-wafer manufacturing. Alpex has also decided to establish a 100 megawatt ingot-and-wafer pilot plant, which management says is likely to enter production by the end of Q1 FY 2027-28 to familiarise its core team with advanced processes.
Management says Alpex is preparing for Phase 1 ingot and wafer manufacturing by June 2028. The company is in advanced stages of finalising technology partners and expects land acquisition for the proposed Uttar Pradesh facilities to conclude shortly, although the presentation gives no capital-expenditure amount or commissioning date for the two planned 5 GW facilities.
Conclusion
Alpex’s H1 FY27 result shows revenue holding near the prior-year level at Rs 885.01 crore, while EBITDA declined to Rs 130.98 crore and PAT fell to Rs 60.06 crore. This first-half movement contrasts with the revenue, EBITDA and PAT expansion reported annually through FY 2025-26, when revenue reached Rs 2,223.27 crore and PAT reached Rs 201.51 crore.
What to watch next is the operational progress of the 2.2 GW G12R TOPCon cell facility, the planned 100 megawatt ingot-and-wafer pilot plant by the end of Q1 FY 2027-28, and management’s Phase 1 preparation for ingot and wafer manufacturing by June 2028. Future reported EBITDA and PAT will show whether management’s stated margin expectation from cell manufacturing is reflected in results.