










Bank Nifty Five-Year Comparison Lacks Supporting Return Data
Key highlights
- No five-year Bank Nifty return is provided in the supplied comparison data.
- Nasdaq 100 delivered about 17.3% average annual returns in US dollars in the cited five-year analysis.
- The stated Indian-market average annual US dollar return was 9.5%, versus 12.6% for the S&P 500.
- Nifty 500 gained 2.81% in US dollars from June 18, while Kospi declined 36.1%.
powered by IRIS
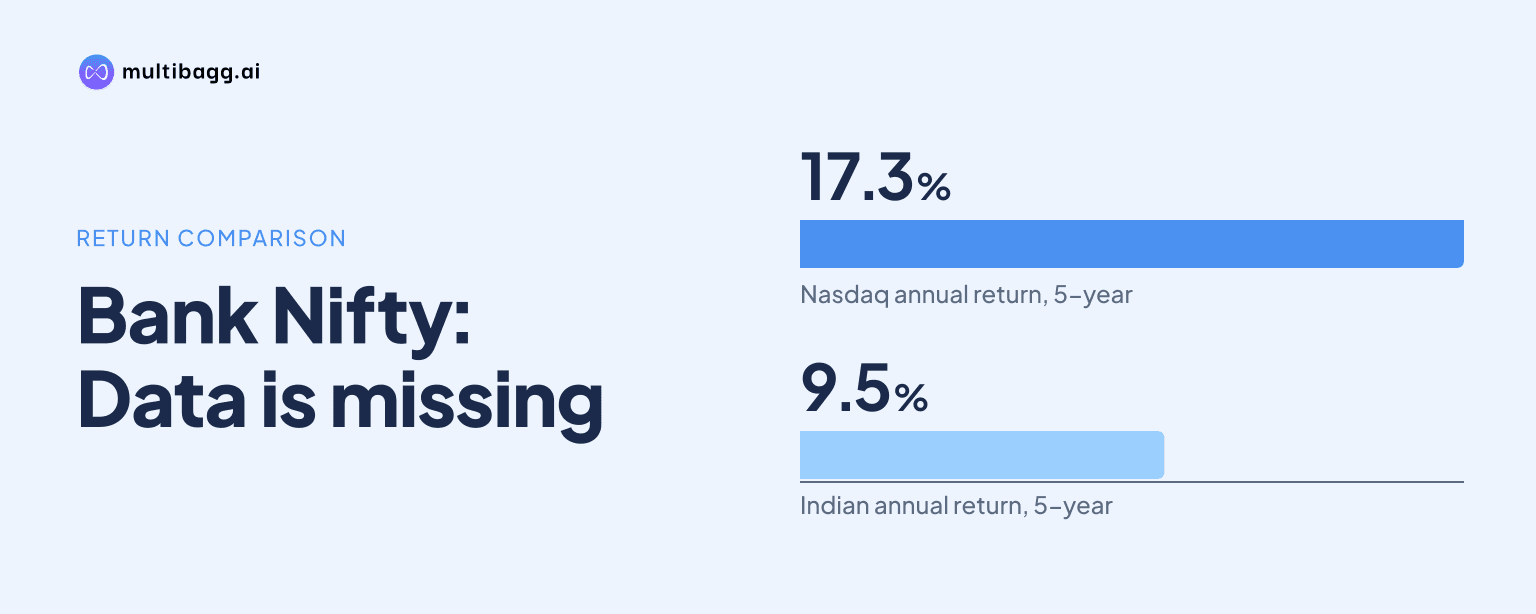
Bank Nifty’s five-year outperformance against the Nasdaq, S&P 500 and Kospi cannot be established from the supplied figures, which instead put the Nasdaq 100’s average annual US dollar return at about 17.3%, versus 12.6% for the S&P 500 and 9.5% for the Indian stock market.
Does the available data prove Bank Nifty beat global markets over five years?
No, the available data does not provide a five-year return series for Bank Nifty. The discussion includes a report that Nifty Bank crossed 63,000 for the first time and rose 1.57%, but it does not give a comparable five-year return for the banking index in either rupees or US dollars.
That distinction matters because Bank Nifty is a sector index, while the overseas comparisons in the material involve broad-market or technology-heavy benchmarks. A claim that Bank Nifty beat the Nasdaq, S&P 500 and Kospi over five years would require returns measured over identical start and end dates, in the same currency, and preferably with a consistent return methodology. None of those Bank Nifty inputs are supplied.
What do the five-year US dollar return figures show?
The five-year figures cited in the discussion show the Nasdaq 100 ahead of the S&P 500 and the Indian stock market in average annual US dollar returns. Nasdaq 100 delivered around 17.3% a year, compared with 12.6% for the S&P 500, 9.8% for Germany and 9.5% for India.
The same material says the Nasdaq 100 generated returns of at least 12% in 85% of five-year periods, while India achieved that threshold in 28% of such periods. These figures support the conclusion that US equities, particularly the Nasdaq 100, had stronger recent five-year US dollar performance and greater consistency than the stated Indian-market comparison. They do not identify Bank Nifty as the Indian benchmark or establish its performance.
Got a follow-up? Ask IRIS
Why do shorter-period comparisons tell a different story?
Shorter-period comparisons show Indian equities outperforming several global peers, but they cannot be used as proof of a five-year Bank Nifty result. In the figures attributed to Helios Capital founder and fund manager Samir Arora, the Nifty 500 gained 2.81% in US dollar terms from June 18, while the S&P 500 rose 1.03% and the Nasdaq Composite declined 4.6%.
Other markets in that comparison fell more sharply. The Kospi declined 36.1%, the Nikkei 225 fell 14.87%, the Taiwan Stock Exchange Weighted Index dropped 12.8%, the MSCI Emerging Markets index lost 13.96%, and Asia ex-Japan declined 15.1%. This was a defined, shorter window involving the Nifty 500, not Bank Nifty. Its result shows relative performance over that period only.
Why is index composition important in this comparison?
Index composition makes direct conclusions from headline returns more difficult. The supplied discussion says information technology accounts for roughly 66.4% of the Nasdaq 100, while the S&P 500 has 37.9% in information technology, 9.5% in communication services and 12.3% in financial services.
The Nifty 500, by contrast, is described as having a different economic character, with financials more important than in the S&P 500. The five-year correlation between the Nifty 500 and S&P 500 was 0.19 from August 2021 to August 2026, while their respective compound annual growth rates were 10.01% and 11.19%. A bank-focused index such as Bank Nifty would have an even more concentrated sector exposure than the Nifty 500, so it should not be treated as interchangeable with a broad Indian-market proxy.
Conclusion
The evidence supplied does not support a five-year claim that Bank Nifty outperformed the Nasdaq, S&P 500 and Kospi. The available five-year US dollar figures favour the Nasdaq 100 at 17.3% annualised, ahead of the S&P 500 at 12.6% and the stated Indian-market return of 9.5%. Separately, the Nifty 500 was stronger in the shorter period from June 18, illustrating why timeframe and benchmark selection can change the result.
The next point to watch is whether a comparable Bank Nifty return series is provided for the same five-year dates and currency as the overseas benchmarks. Investors should also separate the Nifty 500’s 2.81% US dollar gain in the specified shorter window from long-term results, and assess how sector concentration affects any comparison with technology-led US indices or the Kospi.