










BEW Engineering Limited H1 revenue falls 26%, PAT drops 73%
Key highlights
- BEW’s H1 FY27 revenue fell 26.38% year on year to Rs 64.12 crore.
- BEW’s H1 FY27 PAT declined 72.55% year on year to Rs 1.71 crore.
- BEW’s EBITDA margin excluding other income narrowed to 9.33% from 13.43% in H1 FY26.
- Filters generated 73.35% of BEW’s H1 FY27 revenue, while domestic sales accounted for 97.06%.
powered by IRIS
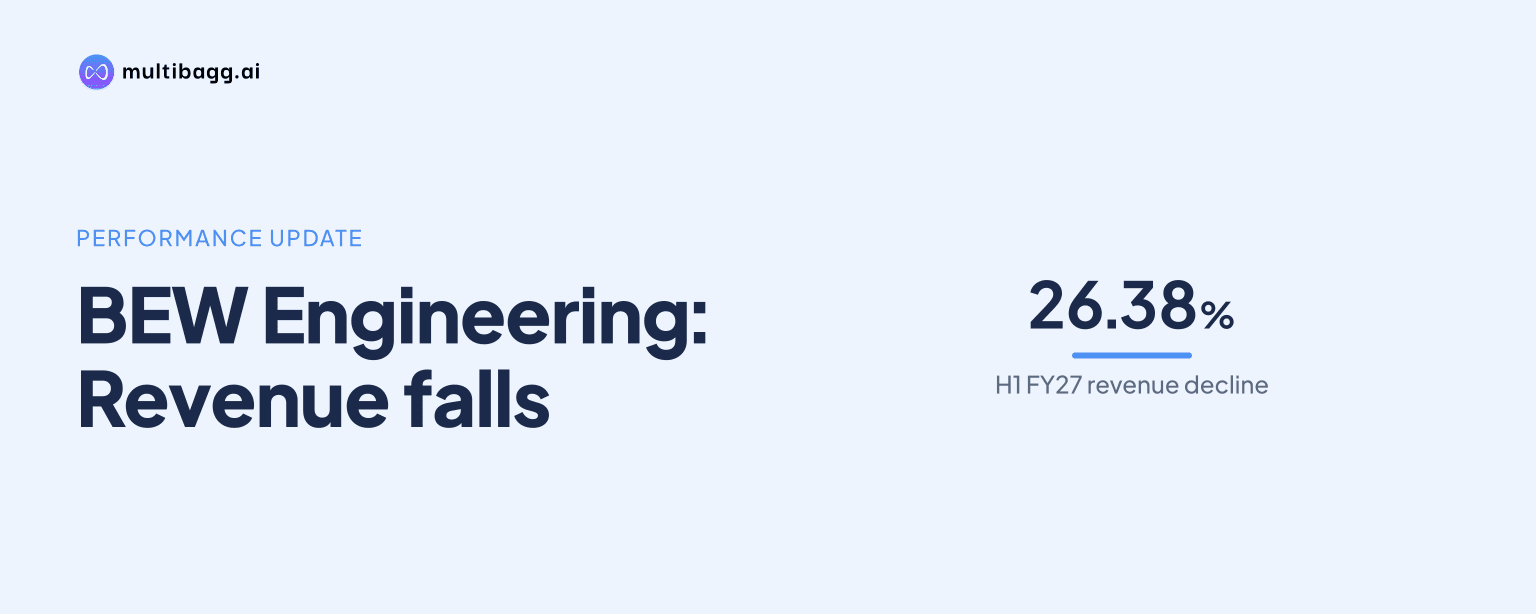
BEW Engineering Limited reported revenue of Rs 64.12 crore in the first half of fiscal year 2027 (H1 FY27), down 26.38% year on year, while profit after tax (PAT) fell 72.55% to Rs 1.71 crore. Its earnings before interest, tax, depreciation and amortisation (EBITDA) margin declined to 9.33% from 13.43%.
Know BEW Engineering inside out
Results, valuation, peers and who's buying, in one view.
Why did BEW’s H1 FY27 revenue decline?
BEW’s H1 FY27 revenue declined because income from operations fell to Rs 64.12 crore from Rs 87.10 crore in H1 FY26, a reduction of Rs 22.98 crore. Management said it had adopted a cautious approach to revenue enhancement because of a highly volatile global scenario, while describing demand across its key end-user industries as sustained. Revenue was also below the Rs 98.44 crore reported in H2 FY26, although both figures cover six-month periods.
The cost base declined less sharply than sales in H1 FY27. Total expenditure decreased 22.89% to Rs 58.14 crore from Rs 75.40 crore, compared with the 26.38% fall in income. Raw-material expenditure was Rs 50.93 crore versus Rs 67.93 crore, while employee cost rose to Rs 3.64 crore from Rs 3.37 crore. As a result, EBITDA excluding other income nearly halved to Rs 5.98 crore from Rs 11.70 crore.
How far did BEW’s profitability fall below earlier levels?
BEW’s H1 FY27 PAT fell to Rs 1.71 crore from Rs 6.23 crore a year earlier, and its PAT margin narrowed to 2.67% from 7.15%. Profit before tax declined 71.57% to Rs 2.34 crore, while earnings per share fell to Rs 1.31 from Rs 4.78. The presentation’s headline panel gives EBITDA of Rs 6.09 crore and a 9.47% margin, whereas the detailed half-year table reports Rs 5.98 crore excluding other income and a 9.33% margin.
The longer trend shows that BEW had not returned to its FY24 profitability level. BEW generated revenue of Rs 120.76 crore in FY24, EBITDA of Rs 23.91 crore and PAT of Rs 13.56 crore, producing EBITDA and PAT margins of 19.80% and 11.23%, respectively. Revenue then increased to Rs 185.54 crore in FY26, but EBITDA fell to Rs 9.61 crore and PAT to Rs 3.78 crore; the corresponding margins were 5.18% and 2.04%.
Got a follow-up? Ask IRIS
Which products and markets generated BEW’s H1 FY27 revenue?
BEW’s H1 FY27 revenue was concentrated in filters and domestic sales: filters accounted for 73.35% of revenue and domestic customers for 97.06%. Dryers contributed 9.64%, other products 6.41%, reactors 5.66%, blenders 4.16% and tanks 0.78%. This differs substantially from FY26, when dryers accounted for 48.50% of revenue, other products 37.00% and filters only 6.40%.
Active pharmaceutical ingredient and pharmaceutical customers were BEW’s largest industry exposure in H1 FY27 at 61.5%, followed by chemical and specialty chemicals at 25.6% and agrochemicals and pesticides at 10.5%. In FY26, active pharmaceutical ingredient and pharma represented 29.2%, specialty chemicals 28.7%, agrochemicals and pesticides 8.4%, and others 33.7%. Export share rose to 2.94% in H1 FY27 from 0.96% in FY26, but domestic business remained the main source of sales.
Can BEW’s operational plans address costs and capacity?
BEW has outlined operational measures intended to improve productivity, energy costs and capacity, but the presentation does not quantify their expected financial impact. Solar-panel installation was targeted for completion by 15 December 2026, with active load distribution from January 2027, financed through State Bank of India’s Surya Shakti Cell. Management said the project is expected to reduce conventional-electricity dependence and power costs, contributing positively to operating margins in coming periods.
The expanded adjacent production facility began partial production in October 2026 and is scheduled for full utilisation from April 2027. SAP Business One, an enterprise-resource-planning system, was in final parallel testing and production-record updating, with a complete shift targeted from FY27-28. These initiatives occur while average indicative stainless-steel prices rose to Rs 345 per kg in September 2026 from Rs 325 per kg in FY26; average Hastelloy prices were Rs 5,000 per kg, compared with Rs 5,050 per kg in FY26.
BEW’s disclosed order-book figures provide visibility but are not identical across presentation pages. The H1 highlights list an order book of about Rs 61 crore as of 30 September 2026, while the detailed financial page cites a confirmed order book of about Rs 58 crore plus multiple enquiries under discussion. Working-capital days also increased: inventory rose to 416 days from 252 in FY26, receivables to 174 from 126, and net working capital to 395 days from 270.
Conclusion
BEW’s H1 FY27 figures show that a 26.38% revenue decline was accompanied by a larger 48.89% reduction in EBITDA excluding other income and a 72.55% fall in PAT. The resulting 9.33% EBITDA margin and 2.67% PAT margin were above FY26’s full-year margins but remained below the FY24 levels of 19.80% and 11.23%, respectively.
The next disclosed milestones are the solar project’s targeted 15 December 2026 completion, active load distribution from January 2027, and full utilisation of the expanded facility from April 2027. BEW also targets a complete SAP shift from FY27-28; whether the stated Rs 58 crore to Rs 61 crore order book converts into revenue and whether inventory and receivable days moderate remain unresolved.