










BEW working-capital cycle reaches 395 days in H1 FY27
Key highlights
- BEW’s net working-capital cycle increased by 125 days to 395 days in H1 FY27 from 270 days in FY26.
- BEW’s inventory days rose to 416 in H1 FY27 from 252 days in FY26.
- BEW’s receivable days increased to 174, while payable days increased to 195 in H1 FY27.
- BEW’s cash and cash equivalents fell to Rs 0.47 crore on 30 September 2026 from Rs 3.88 crore on 31 March 2026.
powered by IRIS
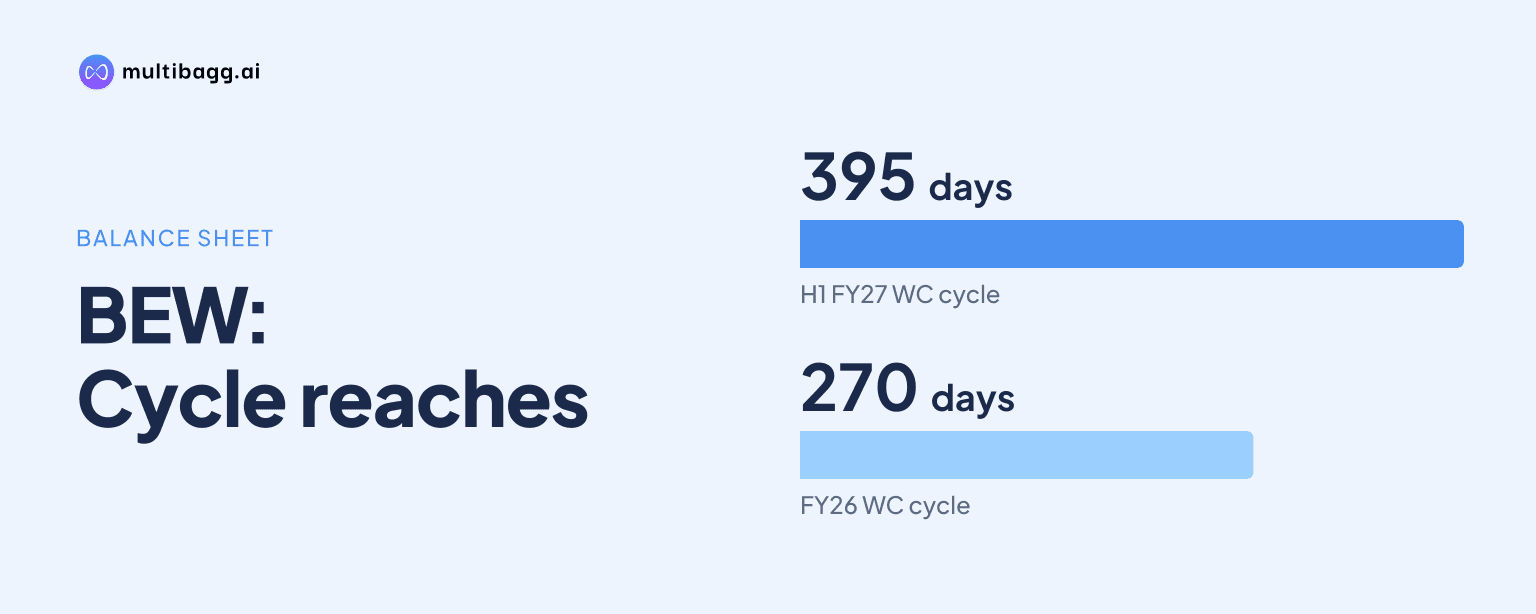
BEW Engineers and Works Private Limited reported a 395-day net working-capital cycle in H1 FY27, up from 270 days in FY26, as inventory days rose to 416 from 252 and receivable days reached 174 from 126. The increase came as cash and cash equivalents fell to Rs 0.47 crore on 30 September 2026.
Know BEW Engineering inside out
Results, valuation, peers and who's buying, in one view.
Why did BEW’s working-capital cycle rise to 395 days?
BEW’s net working-capital cycle rose by 125 days from FY26 to H1 FY27 because increases in inventory and receivable days exceeded the additional credit available through payables. Inventory days increased by 164 days, from 252 to 416, while receivable days rose by 48 days, from 126 to 174. Payable days increased by 87 days, from 108 to 195, partly offsetting those movements.
The 395-day reading was three days below the company’s prior annual high of 398 days in FY25, and it reversed the improvement recorded in FY26. Net working capital had declined from 398 days in FY25 to 270 days in FY26 before rising again in H1 FY27. The H1 FY27 figure therefore marked a change from the preceding full year’s trend.
How much of BEW’s cycle increase came from inventory?
Inventory was the largest contributor to BEW’s longer cycle, with stockholding days reaching 416 in H1 FY27. That was 164 days higher than FY26’s 252 days, 97 days above FY25’s 319 days, and the highest inventory-days figure in the FY22 to H1 FY27 series supplied by management.
The balance sheet shows inventories of Rs 127.98 crore on 30 September 2026, compared with Rs 128.33 crore on 31 March 2026. Although the inventory balance declined by Rs 0.35 crore, the reported inventory-days measure increased substantially. BEW’s H1 FY27 income from operations was Rs 64.12 crore, down from Rs 87.10 crore in H1 FY26, while the presentation does not specify the operational or product-level reasons for the 416-day inventory position.
BEW designs and manufactures process equipment for pharmaceutical and chemical industries, and dryers accounted for 48.50% of FY26 revenue. Other products represented 37%, filters 6.40%, reactors 6.10%, blenders 1.50% and tanks 0.20%. The presentation does not allocate inventory by product category, so it does not identify whether dryers or another equipment line accounted for the higher inventory days.
Did BEW collect customer payments more slowly in H1 FY27?
Yes, BEW’s receivable days increased to 174 in H1 FY27 from 126 in FY26, extending the collection cycle by 48 days. This followed an increase from 39 days in FY24 to 110 days in FY25 and then 126 days in FY26. The H1 FY27 figure is the highest reported in the six-period series.
Trade receivables were Rs 59.84 crore on 30 September 2026, compared with Rs 63.89 crore on 31 March 2026. The receivable balance therefore declined by Rs 4.05 crore even as the days measure rose. BEW reported H1 FY27 total income of Rs 64.12 crore, 26.38% below Rs 87.10 crore in H1 FY26, and the presentation provides no ageing schedule or customer-wise collection detail.
BEW’s FY26 geographical revenue was 99.04% domestic and 0.96% export. Its industry revenue included API and pharma at 29.2%, speciality chemicals at 28.7%, agrochemicals and pesticides at 8.4%, and other industries at 33.7%. Management did not disclose receivable days by domestic and export customer or by industry segment.
Got a follow-up? Ask IRIS
Did supplier credit offset BEW’s higher inventory and receivables?
Supplier credit offset part, but not all, of BEW’s higher inventory and receivable requirements: payable days rose to 195 in H1 FY27 from 108 in FY26. The 87-day increase was larger than the 48-day rise in receivable days but smaller than the 164-day increase in inventory days. The net effect was a 125-day increase in the net working-capital cycle.
Trade payables stood at Rs 54.57 crore on 30 September 2026, marginally below Rs 54.93 crore on 31 March 2026. Short-term borrowings also declined to Rs 53.29 crore from Rs 54.17 crore, while long-term borrowings increased to Rs 9.46 crore from Rs 8.50 crore. These balance-sheet movements occurred alongside the increase in payable days to 195.
BEW’s H1 FY27 payable-days figure was higher than the 31 days reported in FY25 and 56 days in FY24, but below the 152 days in FY23. The presentation does not disclose supplier terms, payment ageing or the composition of trade payables. It therefore shows that supplier credit lengthened, but does not explain why it lengthened.
What does BEW’s balance sheet show about funding and liquidity?
BEW’s cash and cash equivalents declined to Rs 0.47 crore on 30 September 2026 from Rs 3.88 crore on 31 March 2026, a reduction of Rs 3.41 crore. Current assets declined to Rs 194.25 crore from Rs 201.72 crore, while current liabilities increased to Rs 118.81 crore from Rs 117.93 crore. The presentation does not provide a cash-flow statement or identify the uses of the cash balance.
At the same time, shareholder funds increased to Rs 143.04 crore from Rs 141.33 crore. The reported total debt-to-equity ratio remained 0.44 in both FY26 and H1 FY27. Long-term and short-term borrowings together were Rs 62.75 crore in H1 FY27, compared with Rs 62.67 crore on 31 March 2026, indicating little change in the reported borrowing balance.
Non-current assets rose to Rs 78.01 crore from Rs 66.99 crore, mainly as property, plant and equipment increased to Rs 69.87 crore from Rs 59.92 crore. BEW also reported H1 FY27 profit after tax of Rs 1.71 crore, compared with Rs 6.23 crore in H1 FY26, while return on equity was 2.51% and return on assets was 1.26%. These profitability measures were below FY26’s 2.68% and 1.41%, respectively.
Conclusion
BEW’s H1 FY27 figures show that the longer 395-day working-capital cycle was principally associated with a 164-day rise in inventory days and a 48-day increase in receivable days. Longer payables provided a partial counterbalance, while the cash balance fell to Rs 0.47 crore. Debt-to-equity nevertheless remained unchanged at 0.44 because borrowing levels changed little and shareholder funds increased.
The next point to watch is whether BEW’s 2026 production-facility extension, added capacity and stated aim of improving production efficiency through better production-floor planning translate into lower inventory days. Management disclosed the capacity addition and efficiency objective, but did not provide a target date for working-capital improvement or targeted inventory, receivable or cash-balance levels.