










BEW Engineers and Works reports 395-day cycle in H1 FY27
Key highlights
- BEW reported a 395-day net working-capital cycle in H1 FY27, versus 270 days in FY26.
- Inventory days rose to 416 in H1 FY27 from 252 days in FY26.
- Receivable days increased to 174 from 126, while payable days rose to 195 from 108.
- Short-term borrowings were Rs 53.29 crore at 30 September 2026, compared with Rs 54.17 crore at 31 March 2026.
powered by IRIS
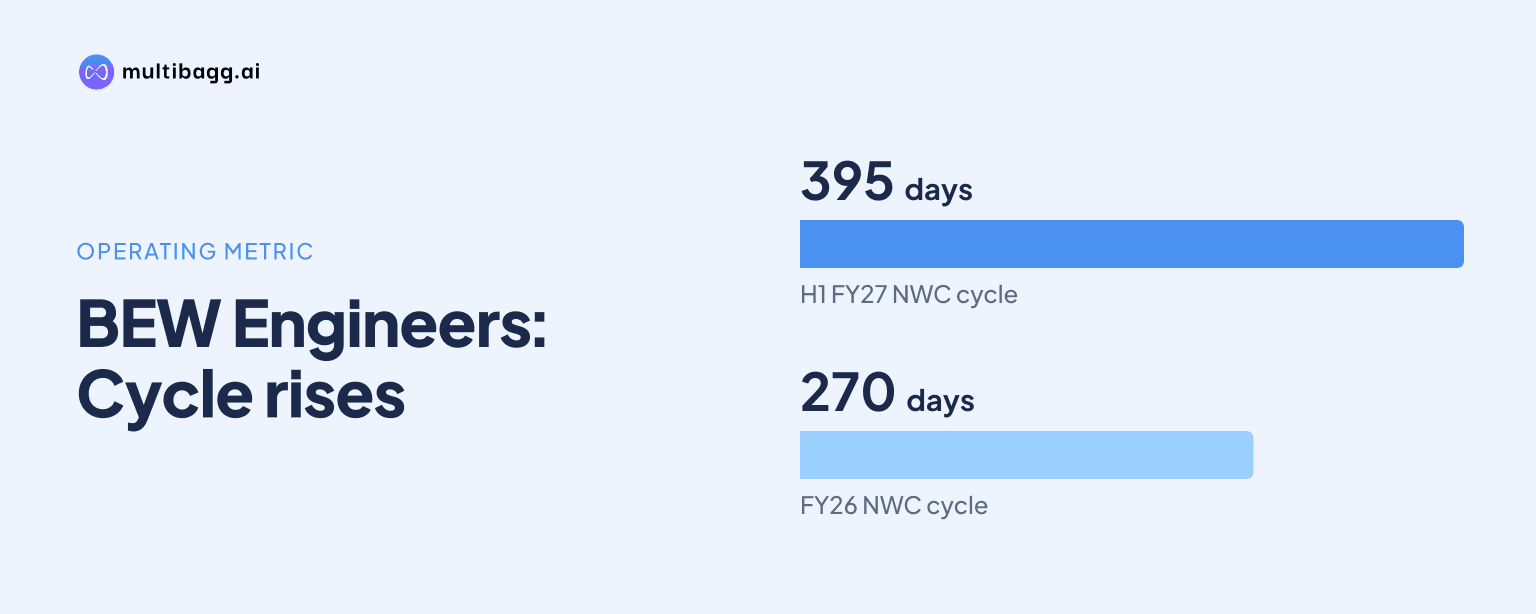
BEW Engineers and Works Private Limited reported a 395-day net working-capital cycle in H1 FY27, up from 270 days in FY26, as inventory and receivable days rose to 416 and 174 respectively. The reported cycle was close to FY25’s 398 days, while short-term borrowings were Rs 53.29 crore at 30 September 2026.
Know BEW Engineering inside out
Results, valuation, peers and who's buying, in one view.
Why did BEW's net working-capital cycle reach 395 days?
BEW’s reported net working-capital cycle reached 395 days in H1 FY27 because 416 inventory days and 174 receivable days were only partly offset by 195 payable days. The presentation’s three component measures reconcile arithmetically to the reported figure: 416 days plus 174 days, less 195 days, equals 395 days. This places more of the operating cycle in inventory and customer dues than in supplier credit.
The 395-day measure was 125 days above FY26’s 270 days, a change driven by a 164-day rise in inventory days and a 48-day rise in receivable days. Payable days also increased by 87 days, from 108 in FY26 to 195 in H1 FY27, providing a partial offset. The cycle had previously reached 398 days in FY25 before falling by 128 days in FY26, so H1 FY27 nearly returned to that earlier level.
The presentation does not disclose the formula used for its day calculations or state whether the H1 FY27 measures are annualised. It does, however, show a multi-year expansion from FY22, when inventory was 247 days, receivables were 16 days and payables were 134 days, producing a 130-day net working-capital cycle. By H1 FY27, the cycle was 265 days longer than the FY22 level.
How did inventory and receivable days change at BEW?
BEW’s inventory days increased to 416 in H1 FY27 from 252 in FY26, while receivable days rose to 174 from 126. Inventory days had been 319 in FY25 and 322 in FY24, meaning the H1 FY27 figure exceeded both prior levels shown in the presentation. Receivable days moved from 44 in FY23 to 39 in FY24, then increased to 110 in FY25, 126 in FY26 and 174 in H1 FY27.
The balance-sheet amounts did not rise alongside the day measures between 31 March 2026 and 30 September 2026. Inventories edged down by Rs 0.35 crore to Rs 127.98 crore, while trade receivables declined by Rs 4.05 crore to Rs 59.84 crore. In the same comparison, income from operations for H1 FY27 was Rs 64.12 crore, down 26.38% from Rs 87.10 crore in H1 FY26, a period-on-period change that coincided with the higher reported days.
The figures show that the increased cycle length should not be read simply as an increase in the closing value of stock or receivables over those six months. Inventory remained the largest current asset at Rs 127.98 crore, representing 65.88% of current assets of Rs 194.25 crore at 30 September 2026. Trade receivables were the second-largest listed current asset at Rs 59.84 crore, while cash and cash equivalents fell by Rs 3.41 crore over the period.
Got a follow-up? Ask IRIS
Did creditor days or borrowings offset BEW's working-capital needs?
BEW’s payable days rose to 195 in H1 FY27 from 108 in FY26, but this increase did not fully offset the 212-day combined increase in inventory and receivable days. Payable days were also above FY25’s 31 days and FY24’s 56 days. In absolute terms, trade payables were broadly stable, declining by Rs 0.36 crore to Rs 54.57 crore at 30 September 2026 from Rs 54.93 crore at 31 March 2026.
BEW’s borrowings were also broadly stable in the six-month balance-sheet comparison. Short-term borrowings fell by Rs 0.88 crore to Rs 53.29 crore, while long-term borrowings rose by Rs 0.96 crore to Rs 9.46 crore. Total debt to equity was unchanged at 0.44 in FY26 and H1 FY27, according to the company’s key-ratio table, despite the higher reported working-capital cycle.
Current liabilities rose by Rs 0.88 crore to Rs 118.81 crore at 30 September 2026, compared with a Rs 7.47 crore decline in current assets to Rs 194.25 crore. Other current liabilities increased by Rs 1.54 crore to Rs 10.16 crore, and short-term provisions rose by Rs 0.57 crore to Rs 0.79 crore. Total assets increased by Rs 3.54 crore to Rs 272.25 crore because non-current assets rose by Rs 11.02 crore, including a Rs 9.95 crore increase in property, plant and equipment to Rs 69.87 crore.
What did the H1 FY27 working-capital position coincide with?
BEW’s 395-day working-capital cycle coincided with lower H1 FY27 revenue and profitability than in H1 FY26. Total income declined 26.38% to Rs 64.12 crore, while earnings before interest, depreciation and tax, excluding other income, fell 48.89% to Rs 5.98 crore. The associated margin declined by 410.56 basis points to 9.33% from 13.43%, with one basis point equal to one-hundredth of a percentage point.
Profit after tax was Rs 1.71 crore in H1 FY27, down 72.55% from Rs 6.23 crore in H1 FY26, and the profit-after-tax margin fell to 2.67% from 7.15%. Interest expense fell by Rs 0.41 crore to Rs 2.75 crore, even as the company reported the higher cycle. The presentation separately says finance costs in FY26 were Rs 3.84 crore, below Rs 4.14 crore in FY25, despite higher working-capital deployment during FY26.
The H1 FY27 ratio set also showed return on equity of 2.51%, return on assets of 1.26% and return on capital employed of 4.90%. Those figures compare with 2.68%, 1.41% and 4.49%, respectively, in FY26. BEW reported 159 equipment units in H1 FY27, versus 280 units in FY26, while the presentation does not provide an order-book figure, production schedule or stated working-capital reduction target for the next period.
Conclusion
BEW’s H1 FY27 data show a 395-day net working-capital cycle shaped primarily by 416 inventory days and 174 receivable days, notwithstanding 195 payable days. The cycle widened from 270 days in FY26 even though inventories, receivables, trade payables and short-term borrowings were each slightly lower in rupee terms at 30 September 2026 than at 31 March 2026.
The next disclosures to watch are whether BEW’s inventory and receivable days move down from 416 and 174, and whether this occurs alongside changes in income from operations, which was Rs 64.12 crore in H1 FY27. The presentation reports no explicit cycle target or announced remediation plan, leaving subsequent balance-sheet and ratio updates as the disclosed indicators of progress.