










Blue Star turns operating cash positive at Rs 414.44 crore
Key highlights
- Blue Star generated Rs 414.44 crore of net cash from operating activities in the half year ended September 30, 2026, versus a Rs 728.12 crore outflow a year earlier.
- A Rs 460.11 crore cash release from trade receivables was the largest specified working-capital contributor in the latest half year.
- Cash and cash equivalents fell by Rs 188.42 crore to Rs 169.43 crore after investing and financing outflows exceeded operating cash generation.
- Blue Star’s debt-equity ratio improved to 0.14 at September 30, 2026, from 0.18 at March 31, 2026.
powered by IRIS
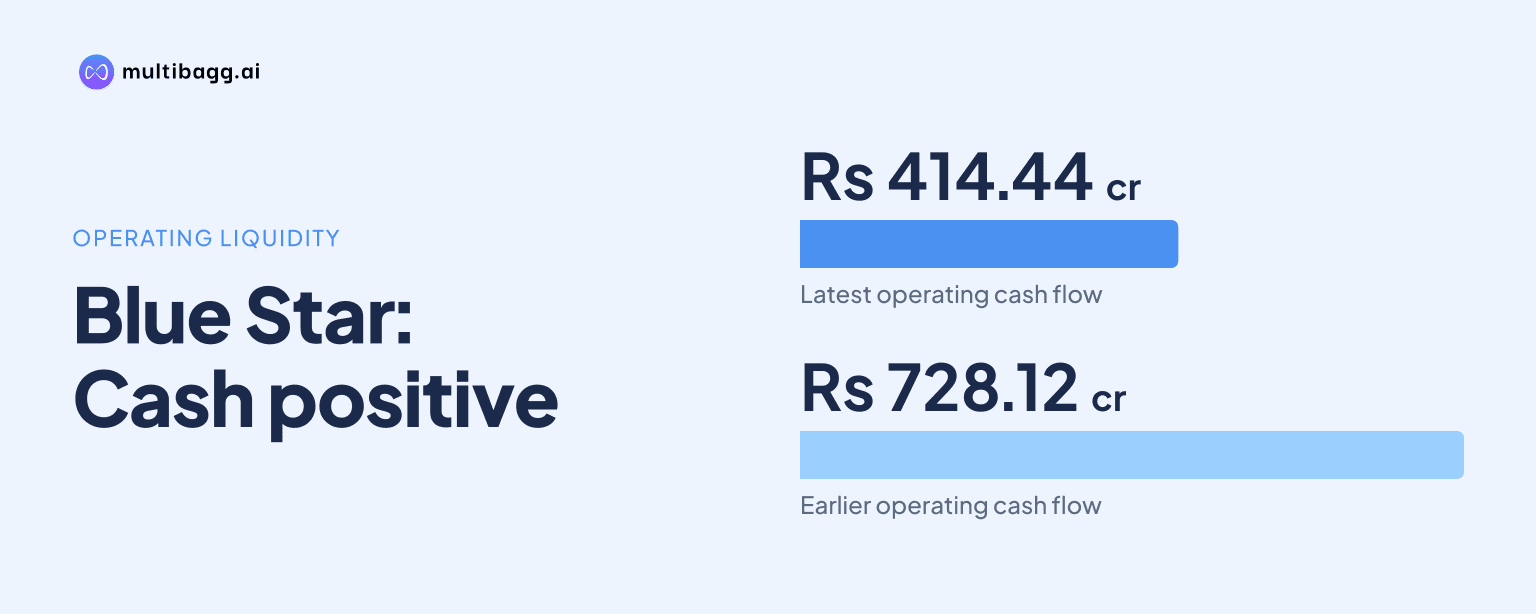
Blue Star Limited generated Rs 414.44 crore of net cash from operating activities in the half year ended September 30, 2026, reversing a Rs 728.12 crore outflow a year earlier. The change came despite lower operating profit before working-capital movements, as a Rs 460.11 crore decline in trade receivables released cash.
Know Blue Star inside out
Results, valuation, peers and who's buying, in one view.
How did Blue Star’s operating cash flow change?
Blue Star moved from using Rs 728.12 crore in operating activities in the half year ended September 30, 2025 to generating Rs 414.44 crore in the half year ended September 30, 2026. Cash generated from operations, before net income-tax payments, was Rs 509.75 crore, compared with cash used in operations of Rs 615.24 crore a year earlier.
Profit before tax edged down to Rs 291.89 crore from Rs 295.40 crore, while operating profit before working-capital changes declined to Rs 352.77 crore from Rs 376.24 crore. Net income taxes paid fell to Rs 95.31 crore from Rs 112.88 crore, but the principal change in operating cash came from movements in working-capital balances.
The half-year figures are consolidated and unaudited, and the Board approved the results on October 29, 2026. The operating-cash figure follows tax payments, whereas the Rs 352.77 crore operating-profit measure is calculated before working-capital changes and is therefore not a cash-flow equivalent.
What drove Blue Star’s working-capital cash movement?
Blue Star recorded a Rs 460.11 crore cash release from trade receivables in the latest half year, the largest specified working-capital contributor. Receivables also released Rs 528.73 crore in the prior-year period, meaning the latest contribution was Rs 68.62 crore lower, but remained a material source of operating cash.
Trade payables used Rs 153.62 crore of cash, substantially below the Rs 956.20 crore outflow in the prior-year half. Financial and other liabilities generated Rs 94.34 crore in the latest period after using Rs 139.66 crore a year earlier, while contract liabilities generated Rs 27.89 crore, compared with Rs 31.05 crore.
Inventory absorbed Rs 108.97 crore and contract assets absorbed Rs 81.25 crore in the half year ended September 30, 2026. Provisions used Rs 23.72 crore and government grants used Rs 1 lakh, compared with a Rs 10.87 crore inflow from government grants and provisions combined in the prior-year period.
Got a follow-up? Ask IRIS
How did receivables, inventories and contract assets change?
Blue Star’s trade receivables fell to Rs 1,674.71 crore at September 30, 2026 from Rs 2,139.70 crore at March 31, 2026, a reduction of Rs 464.99 crore. This balance-sheet movement broadly aligns with the Rs 460.11 crore receivables inflow shown in the cash-flow statement for the half year.
Inventories increased by Rs 108.99 crore to Rs 2,275.19 crore from Rs 2,166.20 crore at March 31, 2026. Current contract assets rose by Rs 83.85 crore to Rs 807.41 crore, while non-current contract assets fell by Rs 2.61 crore to Rs 33 lakh; the cash-flow statement reports a combined Rs 81.25 crore cash outflow from contract assets.
Blue Star reported debtor turnover of 55.32 days for the half year ended September 30, 2026, down from 57.54 days a year earlier. Inventory turnover declined to 83.57 days from 102.50 days, with the company defining these measures using average debtors against revenue and average inventory against cost of goods sold, respectively.
Why did Blue Star’s cash balance decline?
Blue Star’s cash and cash equivalents declined by Rs 188.42 crore during the half year to Rs 169.43 crore at September 30, 2026, despite the Rs 414.44 crore operating inflow. Net cash used in investing activities was Rs 224.58 crore and net cash used in financing activities was Rs 378.28 crore, exceeding operating cash generation.
Investing outflows included Rs 135.83 crore spent on property, plant and equipment and other intangible assets. Purchases of current investments measured at fair value through profit or loss, or FVTPL, totalled Rs 3,428.91 crore, exceeding Rs 3,358.53 crore of disposal proceeds, while deposit investments of Rs 151.79 crore exceeded Rs 117.09 crore received on deposit maturities.
Financing cash use included Rs 145.09 crore of net current-borrowing repayments, Rs 45.50 crore of lease-liability repayments, Rs 13.53 crore of finance costs paid and Rs 174.16 crore of dividends. Commercial papers borrowed and repaid were both Rs 400 crore, while the closing cash figure included Rs 11.77 crore of bank overdraft.
What does Blue Star’s balance sheet show?
Blue Star reported current assets of Rs 6,156.44 crore and current liabilities of Rs 4,650.58 crore at September 30, 2026, compared with Rs 6,388.27 crore and Rs 4,866.26 crore at March 31, 2026. Its reported current ratio was 1.32, compared with 1.31 at the preceding year end and 1.28 a year earlier.
Current borrowings fell to Rs 483.63 crore from Rs 626.80 crore over the six months. Non-current lease liabilities rose to Rs 212.67 crore from Rs 123.75 crore, current lease liabilities increased to Rs 83.30 crore from Rs 59.44 crore, and other current liabilities rose to Rs 785.57 crore from Rs 686.50 crore.
Total assets were Rs 8,485.88 crore at September 30, 2026, down from Rs 8,575.98 crore at March 31, 2026, while total equity increased to Rs 3,489.79 crore from Rs 3,433.86 crore. The debt-equity ratio was 0.14, compared with 0.18 at year end, using total borrowings relative to equity as defined in the filing.
Conclusion
Blue Star’s operating cash reversal was principally a working-capital outcome rather than a profit increase. A Rs 460.11 crore reduction in trade receivables and a much smaller trade-payables outflow outweighed cash absorbed by Rs 108.97 crore of inventory growth, Rs 81.25 crore of contract-asset growth and other assets.
The next results will show whether receivables, inventories and contract assets continue to support or absorb cash after September 30, 2026. Blue Star also identifies its unitary-products segment as seasonal, making subsequent movements in working capital and operating cash flow a disclosed area to watch.