










Bodal export mix falls to 21% as domestic share hits 79%
Key highlights
- Bodal's standalone export revenue mix fell from 33% in FY22 to 21% in FY26.
- Bodal's domestic revenue mix increased from 67% in FY22 to 79% in FY26.
- Bodal reported FY26 consolidated revenue of Rs 2,053.9 crore, including other income.
- Bodal reports operations across more than 30 countries and 4 overseas depots.
powered by IRIS
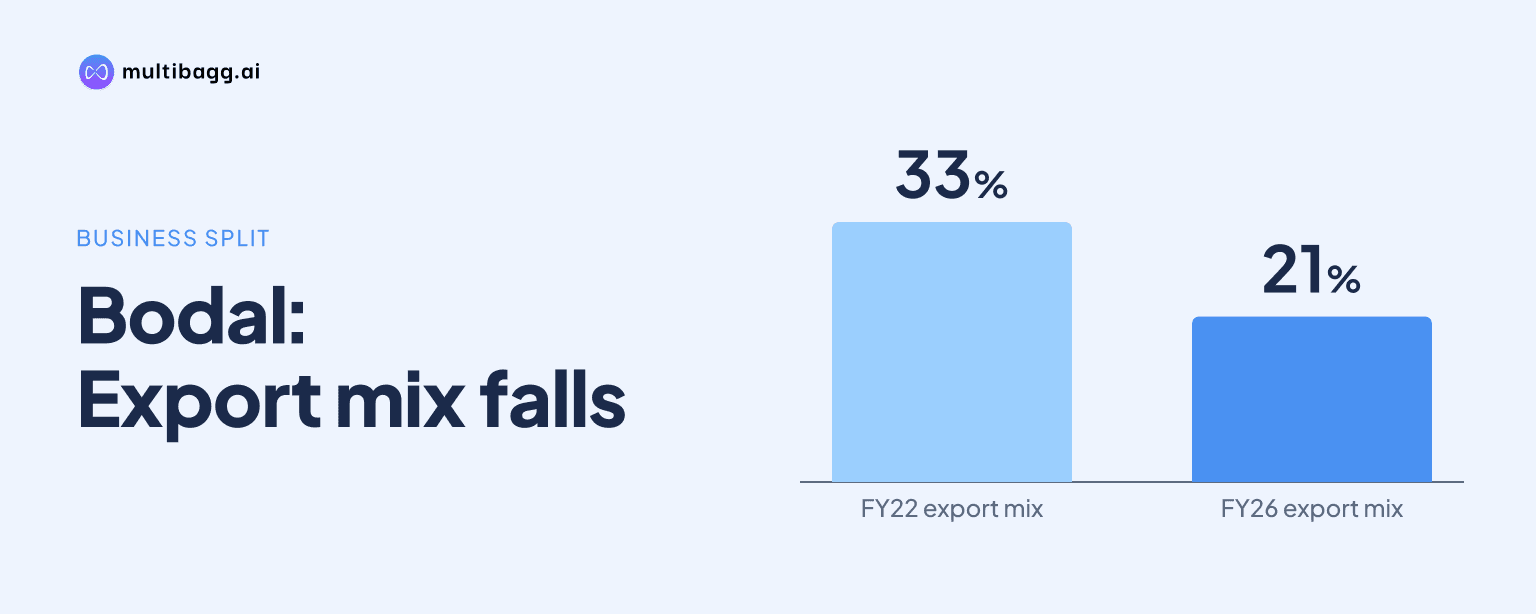
Bodal Chemicals Ltd.'s export revenue share fell to 21% in FY26 from 33% in FY22, while its domestic share rose to 79% from 67%. The 12-percentage-point shift in the company’s standalone geographic revenue mix occurred despite Bodal reporting a presence in more than 30 countries and operating four overseas depots.
Know Bodal Chemicals inside out
Results, valuation, peers and who's buying, in one view.
What does Bodal's five-year revenue mix show?
Bodal's reported mix shows a steady shift toward domestic sales in every year from FY22 through FY26. Domestic revenue represented 67% in FY22, 69% in FY23, 71% in FY24, 75% in FY25 and 79% in FY26. Export revenue moved in the opposite direction, declining from 33% to 21% over the same five-year period.
The change is a 12-percentage-point increase in domestic mix and an equal 12-percentage-point reduction in export mix between FY22 and FY26. The source labels export data as standalone, so these percentages describe Bodal's standalone export mix rather than a consolidated geographic split. Each annual total is shown as 100%, making domestic and export the two components of the displayed mix.
How quickly did Bodal's geographic mix change?
Bodal's domestic share rose by 2 percentage points in FY23, 2 points in FY24, 4 points in FY25 and 4 points in FY26. The largest annual movements therefore occurred in FY25 and FY26, when domestic mix increased from 71% to 75% and then to 79%, while export mix declined from 29% to 25% and then to 21%.
The trend did not reverse in any of the five periods shown. Exports fell by 2 percentage points in each of FY23 and FY24, followed by 4-point declines in FY25 and FY26. This means the export proportion contracted more rapidly in the final two years of the presented series than in the first two, although the presentation does not state why the relative mix changed.
Bodal's geographic chart also carries an approximate statement that about 25% of total revenue comes from exports. The detailed FY26 table gives a 21% export share instead. The presentation does not reconcile the difference, and it also says revenue includes other income while export data are standalone, so the 21% table figure is the specific FY26 data point for the five-year comparison.
How does the mix fit Bodal's FY26 revenue structure?
Bodal reported FY26 consolidated revenue of Rs 2,053.9 crore, including other income, alongside a 79% domestic and 21% export revenue-type split. The source does not provide domestic or export rupee amounts, and applying the standalone percentage split directly to consolidated revenue would mix two differently labelled data sets. The presentation therefore supports a mix comparison, not a calculated FY26 export-revenue amount.
By operating segment, Dye Intermediates were the largest contributor at 36% of FY26 consolidated revenue, followed by Dyestuff at 27% and Chlor Alkali at 17%. Others accounted for 11% and Basic Chemicals for 8%. These segment shares identify the product businesses within Bodal's consolidated revenue base, but the source does not split any segment between domestic and export markets.
The displayed segment structure differs from the geographic mix because one classifies revenue by product business and the other by destination. Bodal presents both classifications for FY26, but does not disclose whether the 12-percentage-point domestic-mix gain since FY22 came from Dye Intermediates, Dyestuff, Chlor Alkali, Basic Chemicals or Others.
Got a follow-up? Ask IRIS
Does Bodal still have an international operating footprint?
Bodal still reports a presence across more than 30 countries, covering North America, Europe, the rest of Asia and South America in addition to India. Its operating network includes 10 depots, comprising six domestic depots and four overseas depots. Those disclosed locations are consistent with continued overseas distribution even as exports accounted for 21% of the FY26 mix.
The company also reports 8 operating manufacturing facilities, more than 200 products and more than 600 customers. In India, Bodal reports more than 70 distributors. The presentation does not quantify country-level revenue, sales by region, depot throughput or the export share of any of its 200-plus products, so it does not identify which overseas markets account for the reduced export proportion.
Bodal's history includes the acquisition of an 80% stake in Sener Boya, described as a Turkish entity, during 2019-20. It also says the Dyestuffs division expanded capacity by 12,000 metric tonnes per annum in 2018 and a further 6,000 metric tonnes per annum in 2019. These events show prior expansion in a business with global-market activity, but the presentation does not connect them to the FY22-to-FY26 revenue-mix movement.
Which customer and product channels support Bodal's domestic presence?
Bodal discloses more than 70 distributors across India and customer lists across its four named product categories, but it does not identify the channels responsible for domestic mix reaching 79% in FY26. Basic Chemicals, Dye Intermediates, Dyestuffs and Chlor Alkali together accounted for 88% of FY26 revenue, with the remaining 11% classified as Others.
The Chlor Alkali customer list includes Trident Group, National Fertilizers Limited, IndianOil, Nestle, Arvind and Welspun India, while the Dyestuffs list includes DyStar, Archroma, Huntsman and Everlight Chemical. The source identifies more than 600 customers overall, but it does not allocate customers or customer revenue by geography.
Bodal also reports that production of specialty benzene downstream products at Saykha, Gujarat started during 2021-24, and that it acquired and upgraded a Chlor Alkali plant in Punjab during the same period. These domestic manufacturing developments overlap with the period in which domestic revenue mix rose from 67% in FY22 to 79% in FY26, but the presentation provides no revenue attribution to either project.
Conclusion
Bodal's disclosed five-year data point to a clear geographic-mix change: domestic revenue gained 12 percentage points while exports lost 12 points, leaving the FY26 split at 79% domestic and 21% export. The result sits alongside an international footprint of more than 30 countries and four overseas depots, indicating that overseas operations remain part of the business even though their reported revenue proportion has declined.
An unresolved matter is the difference between the geographical-footprint page's approximate statement that exports account for about 25% of total revenue and the FY26 table's 21% standalone export figure. A segment-by-geography disclosure would also clarify whether Dye Intermediates, which represented 36% of FY26 revenue, or Dyestuff, at 27%, is driving the shift toward domestic sales.