










CAPRI LOANS gold-loan GNPA rises to 1.2% in Q2 FY27 from 0.3%
Key highlights
- CAPRI LOANS' gold-loan GNPA rose to 1.2% in Q2 FY27 from 0.3% in Q1 FY27.
- CAPRI LOANS' gold-loan NNPA increased to 1.0% in Q2 FY27 from 0.3% in the preceding quarter.
- CAPRI LOANS' Stage 2 gross loans rose to Rs 2,472.3 crore from Rs 1,206.3 crore quarter on quarter.
- CAPRI LOANS' Stage 3 ECL provisioning coverage declined to 33.3% in Q2 FY27 from 43.2% in Q1 FY27.
powered by IRIS
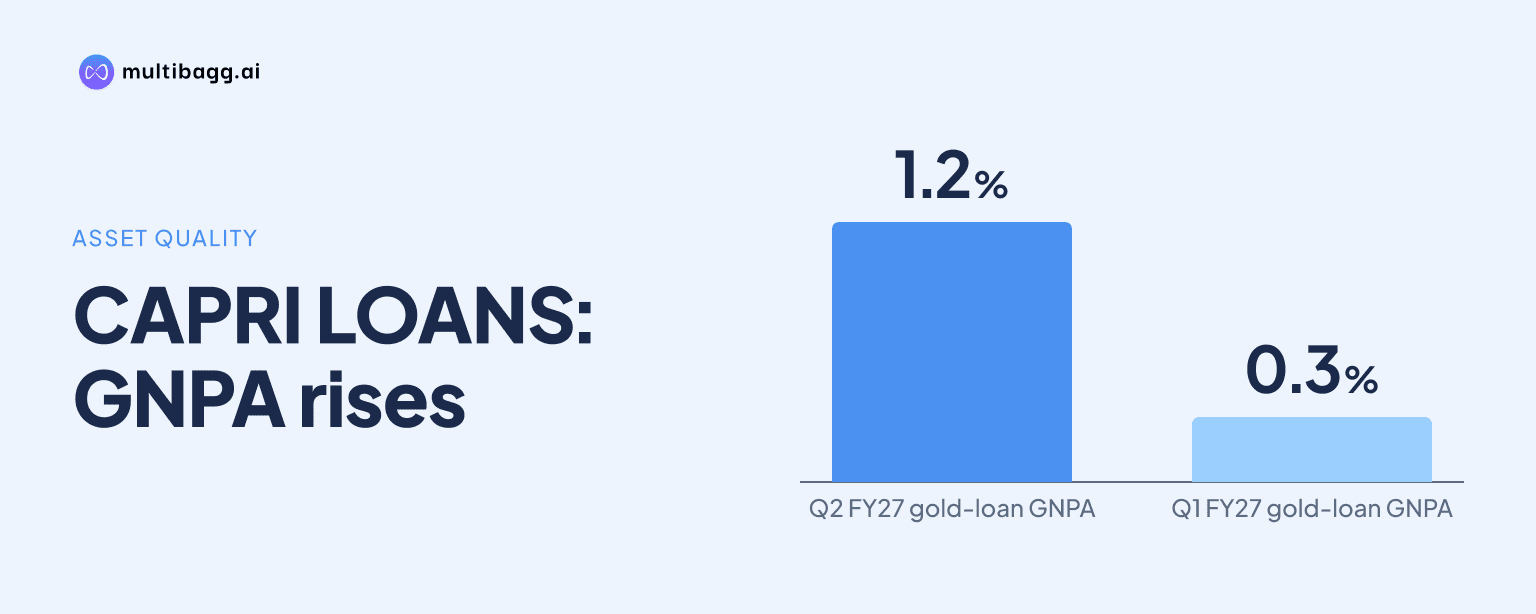
CAPRI LOANS reported gold-loan gross non-performing assets of 1.2% in Q2 FY27, up from 0.3% in Q1 FY27, while net NPAs rose to 1.0% from 0.3%. The movement coincided with total gold assets under management, including co-lending, rising to Rs 21,003.8 crore from Rs 19,178.6 crore in the preceding quarter.
Know Capri Global Capital inside out
Results, valuation, peers and who's buying, in one view.
Why did CAPRI LOANS' gold-loan GNPA rise in Q2 FY27?
CAPRI LOANS' gold-loan gross non-performing assets, or GNPA, rose by 90 basis points sequentially to 1.2% in Q2 FY27 from 0.3% in Q1 FY27. Net non-performing assets, or NNPA, also rose by 70 basis points to 1.0% from 0.3%, showing that the increase extended to the net ratio after provisions.
The presentation does not identify the accounts, collection trends or other factors behind the quarterly change. It shows a reversal from the preceding trend: gold-loan GNPA fell from 0.6% in Q2 FY26 to 0.5% in Q3 FY26 and 0.3% in Q4 FY26, where it remained in Q1 FY27.
The portfolio expanded during the quarter. Gold assets under management excluding co-lending rose to Rs 14,698.7 crore in Q2 FY27 from Rs 13,529.9 crore in Q1 FY27, while gold co-lending assets rose to Rs 6,305.1 crore from Rs 5,648.7 crore. Co-lending includes direct assignment, according to the presentation.
Gold-loan yield also increased to 19.1% in Q2 FY27 from 18.8% in Q1 FY27 and 16.9% in Q4 FY26. CAPRI LOANS calculates yield as interest income, including Indian Accounting Standards adjustments for processing fees, commission and other charges, divided by monthly average outstanding loans.
How did CAPRI LOANS' gold-loan performance compare with other segments?
CAPRI LOANS' gold loans recorded the largest increase in GNPA among its four disclosed lending segments in Q2 FY27. MSME GNPA was unchanged at 3.1%, housing-finance GNPA stayed at 1.2%, and construction-finance GNPA fell to 0.0% from 0.7%, while gold-loan GNPA rose from 0.3% to 1.2%.
MSME remained the segment with the highest GNPA ratio at 3.1% in Q2 FY27, with NNPA unchanged at 1.7%. Housing finance reported GNPA of 1.2% and NNPA of 0.8%, both unchanged from Q1 FY27, placing gold loans at the same GNPA ratio as housing finance but with a higher 1.0% NNPA.
Gold loans had the highest disclosed segment yield at 19.1% in Q2 FY27, compared with 18.6% for construction finance, 16.7% for MSME and 13.7% for housing finance. Gold-loan yield was also 0.3 percentage points higher than the 18.8% reported in Q1 FY27, whereas MSME yield declined by 0.1 percentage point over the period.
The Q2 FY27 gold portfolio of Rs 21,003.8 crore was larger than MSME total assets under management of Rs 7,015.5 crore and housing total assets under management of Rs 8,325.3 crore. Gold co-lending assets accounted for Rs 6,305.1 crore of the gold total, compared with Rs 1,495.1 crore for MSME co-lending and Rs 1,283.1 crore for housing co-lending.
Got a follow-up? Ask IRIS
What changed in CAPRI LOANS' Stage 2 and Stage 3 loans?
CAPRI LOANS' Stage 2 gross loans increased to Rs 2,472.3 crore in Q2 FY27 from Rs 1,206.3 crore in Q1 FY27, more than doubling in value. Stage 2 expected credit loss, or ECL, provisions increased to Rs 134.7 crore from Rs 113.5 crore, but the Stage 2 provision rate declined to 5.4% from 9.4%.
Stage 2 balances are reported for the overall loan book rather than separately for gold loans, so the presentation does not attribute the increase to a particular segment. Total gross loans in the ECL analysis increased to Rs 34,793.8 crore from Rs 31,984.5 crore over the same period, while Stage 2 gross loans rose by more than Rs 1,266 crore.
The Q2 FY27 Stage 2 provision rate was also below 11.8% in Q4 FY26 and 11.1% in Q2 FY26. Stage 2 gross loans had been Rs 821.5 crore in Q4 FY26 and Rs 825.8 crore in Q2 FY26, making the Q2 FY27 balance of Rs 2,472.3 crore notably higher than those earlier reported periods.
Stage 3 gross loans, which CAPRI LOANS uses in its overall gross-NPA measure, rose to Rs 433.7 crore in Q2 FY27 from Rs 338.7 crore in Q1 FY27. Stage 3 ECL provisions decreased slightly to Rs 144.6 crore from Rs 146.5 crore, reducing Stage 3 provisioning coverage to 33.3% from 43.2%.
The overall Stage 3 gross-NPA ratio increased to 1.2% in Q2 FY27 from 1.1% in Q1 FY27, while the Stage 3 net-NPA ratio rose to 0.8% from 0.6%. Stage 1 gross loans rose to Rs 31,887.9 crore from Rs 30,439.5 crore, with the associated ECL provision rate unchanged at 0.6%.
How did CAPRI LOANS' provisions and profitability move in Q2 FY27?
CAPRI LOANS reported total provisions of Rs 79.4 crore in Q2 FY27, up from Rs 62.2 crore in Q1 FY27 and Rs 31.2 crore in Q2 FY26. The sequential increase included Rs 58.2 crore of write-offs in Q2 FY27, compared with negative Rs 26.7 crore reported in Q1 FY27, while ECL provisions declined to Rs 21.2 crore from Rs 88.8 crore.
Profit after tax rose to Rs 418.3 crore in Q2 FY27 from Rs 353.4 crore in Q1 FY27 and Rs 236 crore in Q2 FY26. Operating profit was Rs 636.2 crore, 20% higher quarter on quarter, while total income increased 14% to Rs 1,085.5 crore.
Return on average assets, or RoAA, was 4.4% in Q2 FY27, compared with 4.1% in Q1 FY27 and 4.0% in Q2 FY26. Operating profit as a percentage of average assets increased to 6.6% from 6.2%, while total provisions as a percentage of average assets rose to 0.8% from 0.7%.
The balance sheet reported assets under financing activities of Rs 34,079.3 crore in Q2 FY27, compared with Rs 31,285.5 crore in Q1 FY27 and Rs 20,821.6 crore in Q2 FY26. Bank borrowings were Rs 25,495.5 crore at Q2 FY27, while debt securities increased to Rs 4,993.5 crore from Rs 2,610.4 crore a quarter earlier.
Conclusion
The Q2 FY27 figures combine a higher gold-loan delinquency ratio with a larger portfolio and broader changes in the overall ECL analysis. Stage 2 gross loans rose to Rs 2,472.3 crore, Stage 3 gross loans reached Rs 433.7 crore and Stage 3 ECL coverage declined to 33.3%, while profit after tax rose to Rs 418.3 crore.
The unresolved matter in the presentation is the reason for the gold-loan GNPA movement from 0.3% to 1.2% and how much of the overall Stage 2 increase relates to that segment. Subsequent disclosures can show whether Stage 2 balances, Stage 3 coverage, write-offs and gold-loan GNPA change from their Q2 FY27 levels.