










Capri market borrowing share reaches 14% with ALM surplus
Key highlights
- Capri’s funding profile reached Rs 39,570 crore in Q2 FY27, compared with Rs 31,895.2 crore in FY26.
- Market borrowings represented 14% of Capri’s Q2 FY27 funding mix, up from 8% in FY26.
- Capri reported cumulative ALM surpluses in all six maturity buckets, with Rs 7,526 crore beyond five years.
- Capri reported Rs 30,489 crore of consolidated borrowings and Rs 362.1 crore of undrawn limits in Q2 FY27.
powered by IRIS
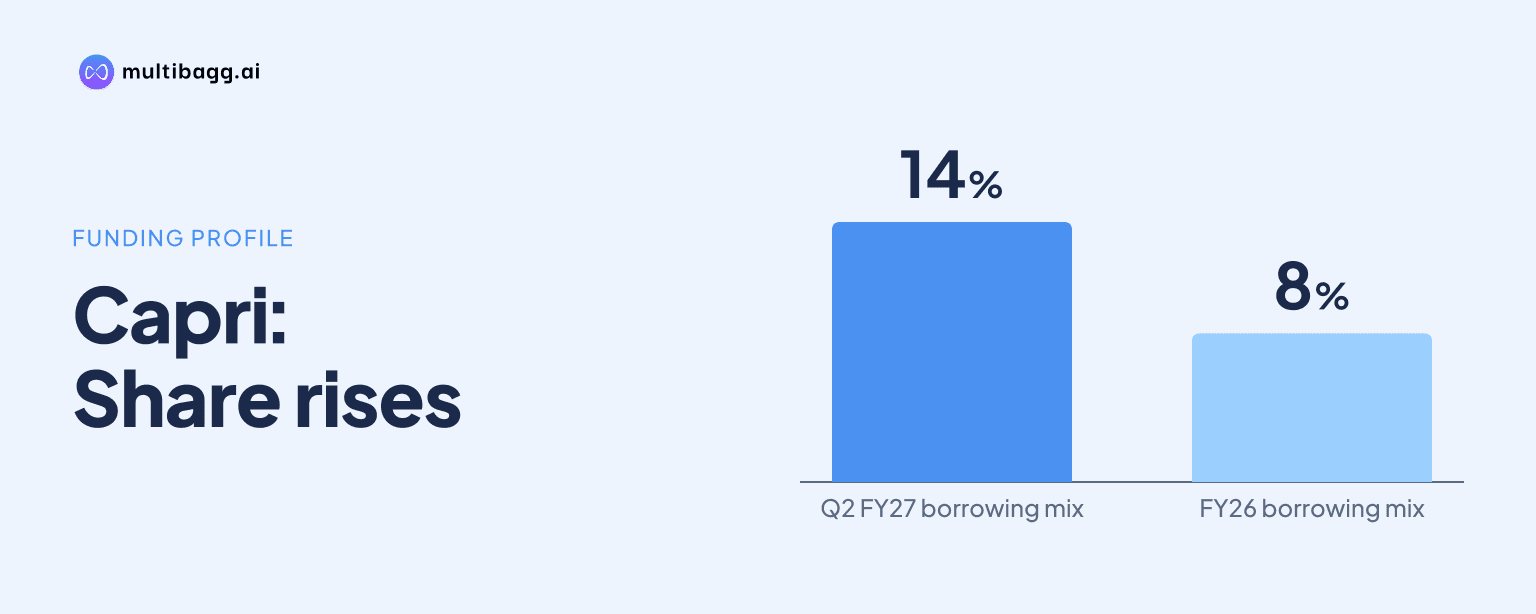
Capri Loans reported market borrowings equal to 14% of its Rs 39,570 crore funding profile in Q2 FY27, while its asset-liability management, or ALM, schedule showed a positive cumulative surplus in each of six maturity buckets. The largest cumulative surplus was Rs 11,302 crore in the more-than-six-to-12-month bucket.
Know Capri Global Capital inside out
Results, valuation, peers and who's buying, in one view.
How has Capri diversified its funding mix by Q2 FY27?
Capri increased the market-borrowing share of its funding profile to 14% in Q2 FY27, from 8% in FY26 and 3% in FY25. Banks remained the largest source at 53%, but their share declined from 55% in FY26, 60% in FY25 and 76% in FY23. The presentation describes the change in the liability mix as diversification led by market borrowings and co-lending.
Capri’s total funding profile rose to Rs 39,570 crore in Q2 FY27 from Rs 31,895.2 crore in FY26 and Rs 19,656.7 crore in FY25. Co-lending and direct assignment, or DA, represented 23% of funding in Q2 FY27, compared with 24% in FY26 and 7% in FY23. Other financial institutions accounted for 7%, while the National Housing Bank, or NHB, and the Others category each represented 2%.
The shift occurred as the overall funding base expanded. From FY23 to Q2 FY27, total funding increased from Rs 8,058.2 crore to Rs 39,570 crore, while the bank share fell by 23 percentage points. Over the same interval, market borrowings rose by 9 percentage points and co-lending/DA rose by 16 percentage points.
What do Capri’s borrowings and available facilities show?
Capri reported consolidated borrowings of Rs 30,489 crore in Q2 FY27, up from Rs 23,981.8 crore in FY26 and Rs 15,576.8 crore in FY25. CGCL Standalone accounted for Rs 24,287.8 crore of the Q2 FY27 total, CGHFL accounted for Rs 6,153.9 crore, and the line item labelled Top label was Rs 47.4 crore.
New credit facilities sanctioned in Q2 FY27 totalled Rs 4,427.6 crore on a consolidated basis. Capri also reported a lender base of more than 40 and undrawn limits of Rs 362.1 crore. These measures provide the disclosed facility and lender-base position alongside the Rs 30,489 crore borrowing balance.
CGCL Standalone borrowings increased from Rs 18,902.6 crore in FY26 to Rs 24,287.8 crore in Q2 FY27, a rise of Rs 5,385.2 crore. CGHFL borrowings increased from Rs 5,178.5 crore to Rs 6,153.9 crore, a rise of Rs 975.4 crore. The consolidated borrowing balance therefore grew by Rs 6,507.2 crore between FY26 and Q2 FY27.
Got a follow-up? Ask IRIS
Does Capri have an asset-liability maturity mismatch?
Capri reported no cumulative ALM mismatch at Q2 FY27 because cumulative net inflow was positive in all six disclosed maturity buckets. The cumulative surplus started at Rs 3,571 crore for maturities up to three months, reached Rs 11,302 crore in the more-than-six-to-12-month bucket, and stood at Rs 7,526 crore beyond five years.
The positive cumulative position does not mean that assets exceeded liabilities in each individual bucket. In the one-to-three-year bucket, assets were Rs 12,966 crore and liabilities were Rs 13,771 crore. In the three-to-five-year bucket, assets were Rs 3,805 crore against liabilities of Rs 10,435 crore, but cumulative surplus remained Rs 9,335 crore because of net inflows in earlier maturity buckets.
After peaking at Rs 11,302 crore in the more-than-six-to-12-month bucket, the cumulative surplus reduced to Rs 10,497 crore in the one-to-three-year bucket and Rs 9,335 crore in the three-to-five-year bucket. The Q2 FY27 schedule nevertheless remained positive at Rs 7,526 crore in the over-five-year bucket, which supports Capri’s stated no-maturity-risk position on a cumulative basis.
How do capital and profit measures compare with funding growth?
Capri’s debt-to-equity ratio, or D/E, was 3.8 times in Q2 FY27, compared with 3.3 times in FY26 and 2.5 times in Q2 FY26. Its capital-to-risk-weighted-assets ratio, or CRAR, was 22.7% on a standalone basis in Q2 FY27, versus 25.8% in FY26 and 32.9% in Q2 FY26. These movements coincided with the increase in the funding profile to Rs 39,570 crore.
Profit after tax was Rs 418.3 crore in Q2 FY27, compared with Rs 236 crore in Q2 FY26. Operating profit rose to Rs 636.3 crore from Rs 345.3 crore, while operating profit as a share of average total assets increased to 6.6% from 5.8%. Book value per share increased to Rs 82.8 in Q2 FY27 from Rs 74.9 in Q4 FY26.
Credit cost, defined by Capri as write-offs plus expected credit loss provisions, was Rs 79.3 crore in Q2 FY27 against Rs 31.2 crore in Q2 FY26. On an annualised basis, credit cost was 0.8% of average total assets, compared with 0.5% a year earlier. Return on average assets was 4.4% in Q2 FY27, while return on average equity was 21.6%.
Conclusion
Capri’s Q2 FY27 disclosures show a broader funding mix alongside a larger funding base: market borrowings reached 14%, banks accounted for 53%, and co-lending/DA represented 23% of Rs 39,570 crore. The ALM schedule reported cumulative surpluses in every maturity bucket, although standalone liabilities exceeded assets in the one-to-three-year, three-to-five-year and over-five-year buckets.
The next disclosures will show whether market borrowings rise beyond the Q2 FY27 14% share while the cumulative ALM balance remains positive. Key disclosed measures to track include Rs 362.1 crore of undrawn limits, more than 40 lenders, and Rs 4,427.6 crore of consolidated credit facilities sanctioned during Q2 FY27.